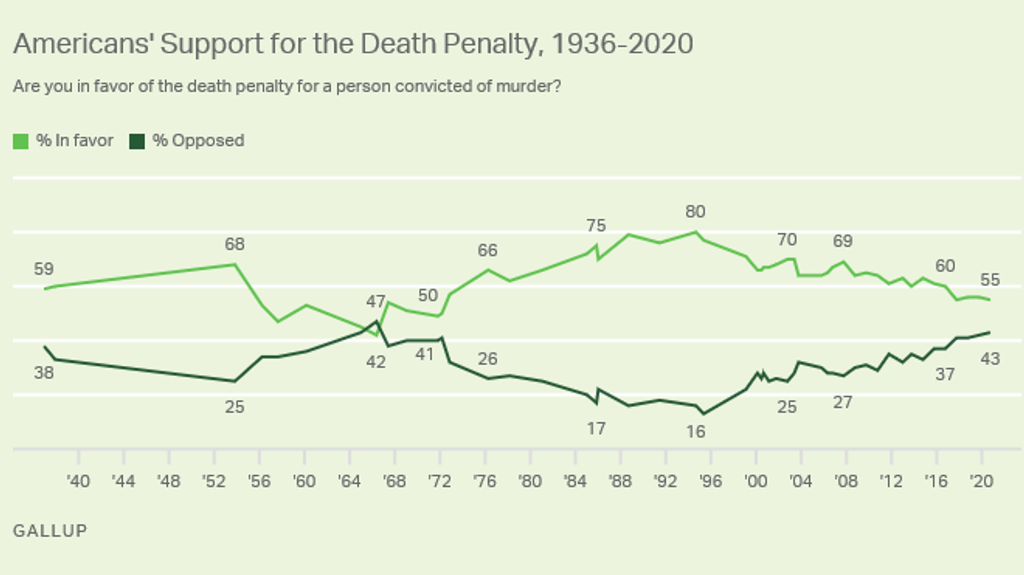
Public support for the death penalty is at its lowest level in a half-century, with opposition higher than any time since 1966, according to the 2020 annual Gallup poll on Americans’ attitudes about capital punishment.
Fifty-five percent of respondents to a national survey conducted between September 30 and October 15, 2020 told Gallup that they were “in favor of the death penalty for a person convicted of murder,” down one percentage point from the levels reported in 2018 and 2019. The figure tied with 2017 for the lowest support for capital punishment since 50% of Americans told Gallup in March 1972 that they were in favor of the death penalty, just months before the U.S. Supreme Court struck down existing death penalty statutes in Furman v. Georgia.
Forty-three percent of respondents told Gallup that they were opposed to the death penalty as a punishment for murder, the most since 47% of Americans expressed opposition to capital punishment in the May 1966 Gallup survey. The number was one percentage point higher than the level of opposition reported in 2019 and two percentage points higher than in 2017 and 2018.
The results followed the continuing pattern of declining death-penalty support found in the organization’s polling. In May 2020, a record-low 54% of Americans said they believed the death penalty is “morally acceptable,” and in October 2018, 49% of Americans — also a new low — said they believed the death penalty was “applied fairly.” The 2019 national survey found that a record 60% of Americans favored life imprisonment over the death penalty, which Gallup called “a dramatic shift from prior years.”
Gallup Senior Editor Jeffrey M. Jones said the pollster’s questions on death penalty trends reflect that “[m]any Americans are … conflicted on the death penalty. … [A]bout one in five Americans express theoretical support for use of the death penalty but believe life imprisonment is a better way to punish convicted murderers,” Jones said.
The Demographics of Death-Penalty Support
The Gallup topline numbers again found substantial differences in support for capital punishment based on gender, race, age, political affiliation, and political ideology. 59% of men said they were in favor of the death penalty, while 39% said they opposed. By contrast, 52% of women favored and 47% opposed capital punishment. Whites favored the death penalty 60%-39%, while non-whites opposed capital punishment 51% to 47%. Younger Americans aged 18-34 opposed the death penalty 52% to 48%, while those aged 35-54 supported it 53%-44%, and those 55 and older supported it 63%-35%.
Level of education also affected views on the death penalty, with college graduates opposing the death penalty 53%-45%, those with some college education supporting it 59%-40%, and those with a high school education or less supporting the death penalty 62% to 37%.
The greatest differences in Americans’ views were reflected in party identification and political ideology. Those currently identifying as Republican overwhelmingly favored the death penalty, 82% to 17%. On the other hand, Democrats opposed the death penalty 58%-39%, while Independents narrowly opposed it, 50%-49%. By 10 percentage points, those identifying as conservatives were less supportive of capital punishment than those identifying as Republicans, with 72% saying they were in favor of the death penalty and 28% saying they were opposed. Those describing themselves as liberal opposed the death penalty, 67% to 32%, while those self-identifying as moderate favored the death penalty, 55%-42%.
Demographics trends show continuing decline in death penalty support
Support for the death penalty has declined among all age groups, across race and ethnicity, and for individuals of every level of educational attainment over the past decade, Gallup reported. For each demographic group, Gallup measured the average level of support for the death penalty for the years 2000-2010, 2011-2016, and 2017-2020. Nationwide, average levels of support for capital punishment declined by 10 percentage points, dropping five percentage points between the 2000s and the first half of the 2010s (from 66% to 61%) and another five percentage points over the past four years (61% to 56%).
Support for the death penalty declined among all generations of Americans, declining more the younger the age group. Support among millennials (born 1980-1996) fell 10 percentage points from 61% in 2000-2010, to 55% in 2011-2016, to 45% over the past four years. It fell 9 percentage points among Generation X (born 1965-1979), from 66% to 63% to 57%; 8 percentage points among baby boomers (born 1946-1964), from 67% to 64% to 59%; and 5 percentage point among traditionalists (born before 1946), from 67% to 65% to 62%.
Support fell 9 percentage points among non-Hispanic white adults, from 70% to 67% to 61%; and 6 percentage points among non-white adults (who already had low support for capital punishment), from 52% to 46%, where it remained over the last four years. Support for capital punishment fell most sharply among college graduates, dropping by 14 percentage points, from 60% to 53% to 46%. It fell 9 percentage points among those who did not attend or did not graduate from college, from 69% to 65% to 60%.
Additionally, Gallup suggested, demographic trends across the United States, “may lead to further erosion in death penalty support.” “Groups that are constituting a greater share of the U.S. adult population over time — including millennials and Generation Z, non-White adults and college graduates — all show below-average support for the death penalty,” Jones said.
Gallup reported continuing declines in death penalty support among those identifying as Democrats or Independents, while support among those identifying as Republicans remained steady. In the years 2000-2010, an average of 55% of Democrats said they supported the death penalty, falling to 47% in 2011-2016 and 39% in 2017-2020. Among Independents, support fell 10 percentage points, from an average of 64% to 61% to 54%. However, average support for capital punishment barely changed among those identifying as Republicans, starting at 80% in 2000-2010 and remaining at 79% in 2011-2016 and 2017-2020.
Sources
Jeffrey M. Jones, U.S. Support for Death Penalty Holds Above Majority Level, Gallup, November 19, 2020; Clyde Hughes, Gallup: Support in U.S. for death penalty at lowest point in decades, UPI, November 19, 2020
Public Opinion
Nov 06, 2023
POLL: For the First Time, More Americans Believe the Death Penalty Is Applied Unfairly in the United States

Sentencing Alternatives
Aug 21, 2023