For in-depth analysis, view DPIC’s Report: The 2% Death Penalty: How a Minority of Counties Produce Most Death Cases at Enormous Costs to All.
INTRODUCTION
Although 28 states authorize the death penalty, it is actually carried out by only a small percentage of jurisdictions. Fewer than 2% of counties in the U.S. account for more than half of the nation’s death-row population and more than 4/5ths of U.S. counties have no one on death row. Fewer than 2% of U.S. counties also account for more than half of all executions carried out across the country since the Supreme Court upheld the constitutionality of capital punishment in 1976 and more than 80% of U.S. counties haven’t executed anyone in that time.
There are clear geographic differences in death penalty usage across the country and within individual states. From the time executions resumed in 1977 through April 2020, 82% of all executions in the United States have taken place in the South. From January 2015 through April 2020, just 5 states — Texas, Georgia, Alabama, Florida, and Missouri — carried out 83% of all U.S. executions. Even within a state, the death penalty is usually pursued in only a handful of counties, though the expense is often shared by all taxpayers.
The Death Penalty Information Center has analyzed the use of the death penalty at the county level, examining:
A. Executions By County
B. Death-Row Prisoners By County
C. Recent Death Sentences By County
The graphics on this and related pages illustrate the geographical disparities in the use of the death penalty across the United States.
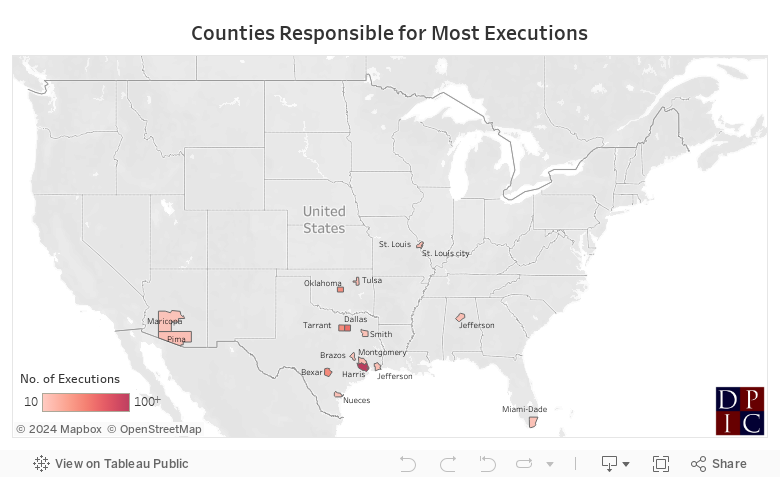
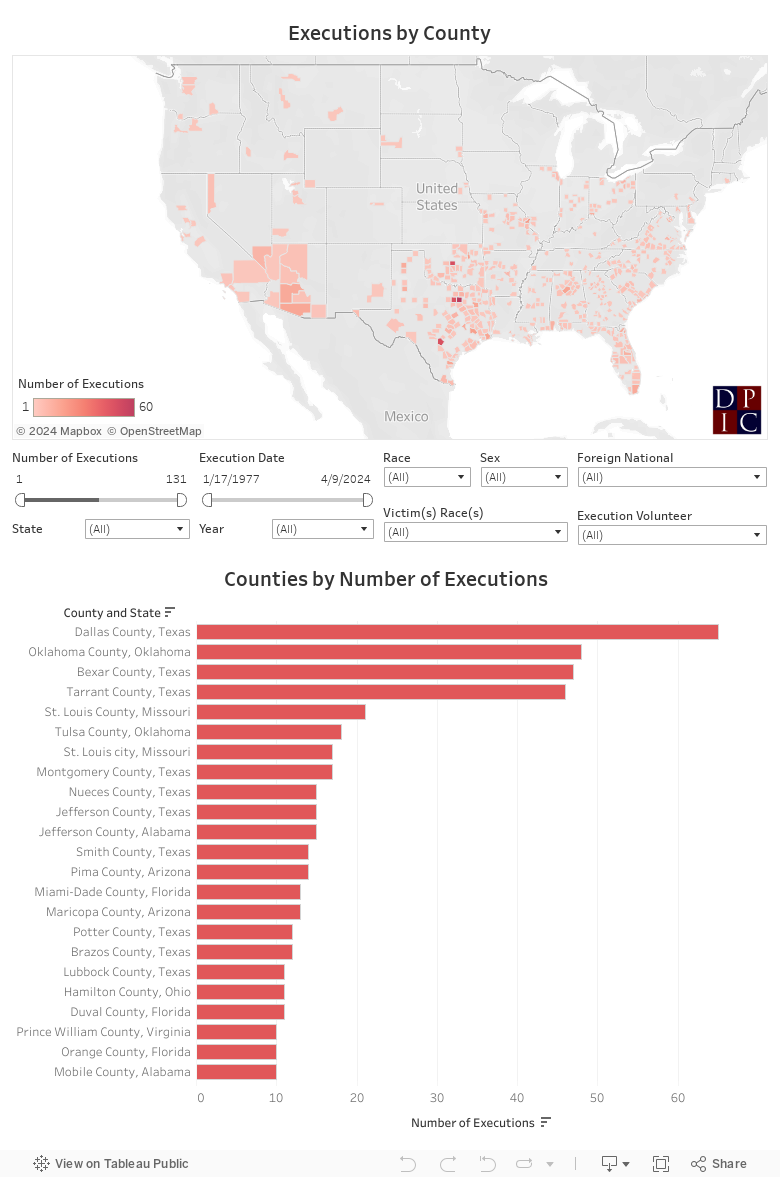
A. Executions by County
Total Number of Counties in the U.S. = 3,143 (source: U.S. Census Bureau)
Just 15 counties account for more than 30% of the executions in the U.S. since 1976. They represent less than 0.5% of the total number of counties in the country, and less than 1% of the total number of counties in states with the death penalty.
Related:
- Executions by County
- Execution Database, sortable by county
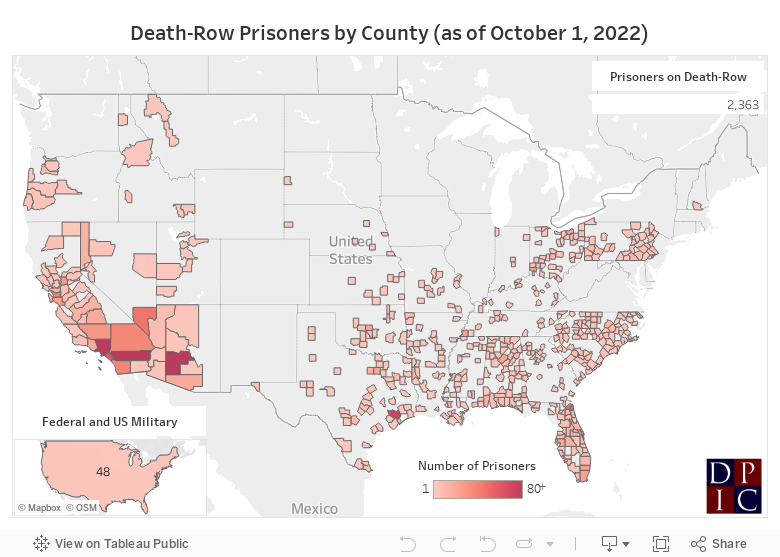
B. Death-Row Prisoners by County
DPIC has identified the county in which every prisoner currently on death row was sentenced to death. The map below is based on the NAACP Legal Defense Fund’s “Death Row USA” list of prisoners on death row as of April 1, 2021. It includes all persons then sentenced to death in the United States, plus defendants whose convictions or death sentences had been overturned on appeal but who still faced the possibility of having their death sentence reimposed in later court proceedings.
Nearly 30% of the entire national death-row population as of January 2020 was sentenced to death in just 10 counties. Collectively, they comprise fewer than 0.3% of all the counties in the United States and fewer than 0.5% of all the counties in states that currently authorize the death penalty. Six of these counties are in states in which governors have imposed moratoria on executions.
Related:
- Death Row
- Death Row by County
- Death Row, USA, from the NAACP Legal Defense Fund
Download a spreadsheet of county data for all on death row as of January 1, 2013.
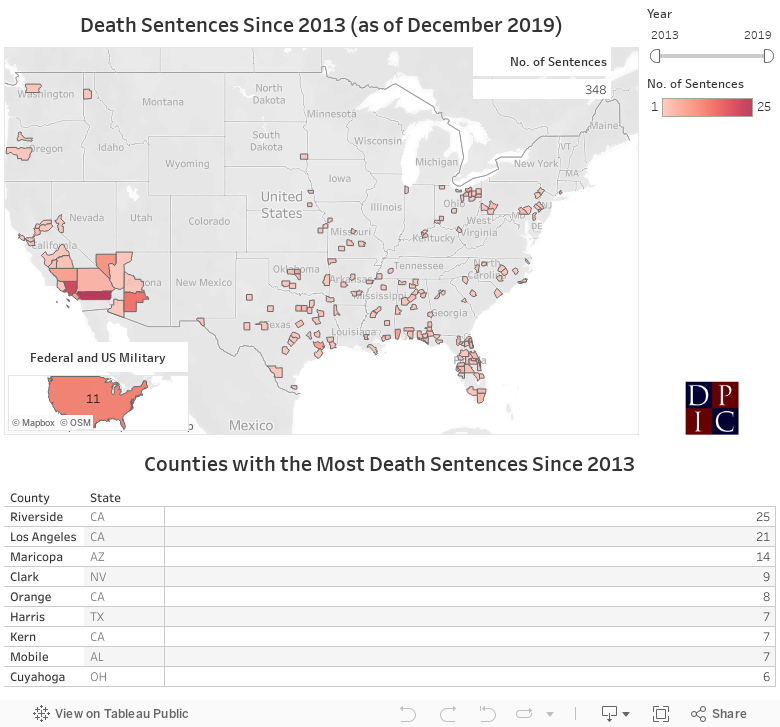
C. Recent Death Sentences by County
Recent death-sentencing practices illustrate the continuing impact of a tiny number of counties on the US death penalty. Just 10 counties — again, fewer than 0.3% of the nation’s counties — accounted for nearly 1/3 of all new death sentences imposed in the United States between January 2013 and December 2019.
Related:
Additional Links:
Arbitrariness
Jan 03, 2024
Overwhelming Percentage of Florida’s Hurst Resentencing Hearings End in Life Sentences

Arbitrariness
Aug 15, 2023