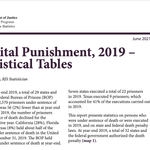
The number of prisoners on death row across the United States continues to decline while the average amount of time they have been on death row approaches 19 years, according to a new report from the Department of Justice Bureau of Justice Statistics (BJS).
BJS’s June 2021 annual death penalty review found that 2,570 prisoners were under sentence of death in the custody of 29 states and the U.S. federal government as of December 31, 2019, down 2.1% from the 2,626 prisoners on death row at the end of 2018. BJS reports that 2019 was the nineteenth consecutive year in which the number of prisoners on the nation’s death row declined, down by more than a thousand since reaching a peak of 3,601 in 2000.
The decrease in the number of death-sentenced prisoners comes even as the average duration of their stay on death row prior to exoneration, resentencing, death, or execution approaches two decades. BJS reports that the average amount of time a prisoner has been incarcerated pursuant to their latest death sentence is 18.7 years. That figure is calculated from the date of a prisoner’s latest death sentence and does not take into consideration the time nearly 10% of those on death row had previously been imprisoned because of unconstitutional capital trials or death sentences that had been judicially reversed. More than half of the prisoners currently on death row (1,317, or 51.7%) were sentenced to death in 2000 or earlier.
For the 22 prisoners put to death in 2019, the average time elapsed between the imposition of their death sentence and their execution was 264 months, or 22 years, by far the longest time between sentence and execution since capital punishment resumed in the U.S. in the 1970s. It represents a 21-month increase over the 243-month time span between sentence and execution in 2017 — the only other time the average surpassed 20 years. The average in 2019 was 26 months longer than 2018’s 238-month average time lapse between sentence and execution.
The report provided further evidence of the aging of death row. Both the average and the median age of prisoners on death row at the end of 2019 was 51 years, and 22.4% of death row prisoners were age 60 or older. That compares to the year-end 2000 figures, when the average and median age of death-row prisoners was 38 and 2.7% of death-row prisoners had reached age 60.
The educational level of new admissions to death row suggested the greater vulnerability of defendants now being sentenced to death. More than half of the new death-row prisoners had less than a high school education and 31.3% had completed 8th grade or less. Among all death-row prisoners, 44.6% completed 11th grade or less and 11.8% had completed 8th grade or less.
Death row shrank by 56 prisoners in 2019, representing 87 prisoners who came off death row and 31 who were added. Death rows grew in only three states (North Carolina, South Carolina, and Ohio), which increased by a combined total of six prisoners. By comparison, 19 states saw their death rows shrink. California (11), Pennsylvania (8), Texas (7) and Tennessee (6) accounted for 57.1% of the reduction nationally, while no other state had as much as a five-prisoner shift in size.
Execution, once again, was not the main reason prisoners were removed from death row in 2019: three-quarters (74.7%) of those who came off death row were not executed. More than half the prisoners who came off death row in 2019 had their convictions or death sentences overturned by courts (43) or received sentence commutations (2). Twenty-two prisoners were executed and 20 more died on death row of other causes. The executions reflected the continuing geographic isolation of the death penalty, with 20 of the 22 executions carried out in the South.
The BJS report corroborates DPIC’s June 2020 analysis of the time death-row prisoners are spending on death row. At that time, DPIC reported that, as of January 1, 2020, at least 1,344 death-row prisoners — more than half of the nation’s total — had been on death row for 20 or more years, in violation of U.S. human rights obligations. DPIC reported that an additional 191 prisoners had been executed in the United States since the 1970s after spending 20 or more years on death row.
Tracy L. Snell, Capital Punishment, 2019 – Statistical Tables, U.S. Department of Justice, Bureau of Justice Statistics, June 2021.
Death Row Overview
May 22, 2023

Death Row USA Summer 2022 Report: Death-Row Population Continues Long-Term Decline
Time on Death Row
Mar 20, 2023

INTERNATIONAL: Longest Serving Death Row Prisoner in the World Has Case Reversed
Death Row Overview
Mar 14, 2022
