The Death Penalty in 2015: Year End Report
Posted on Dec 15, 2015
- PRESS RELEASE
- INFOGRAPHIC: "The Death Penalty in the U.S."
- GRAPHICS FOR SOCIAL MEDIA
- 2015 SENTENCING DATA
PRESS RELEASE Top
FOR IMMEDIATE RELEASE
Death Penalty Use in 2015 Declines Sharply
Fewest Executions, Fewest Death Sentences, and Fewest States Employing the Death Penalty in Decades
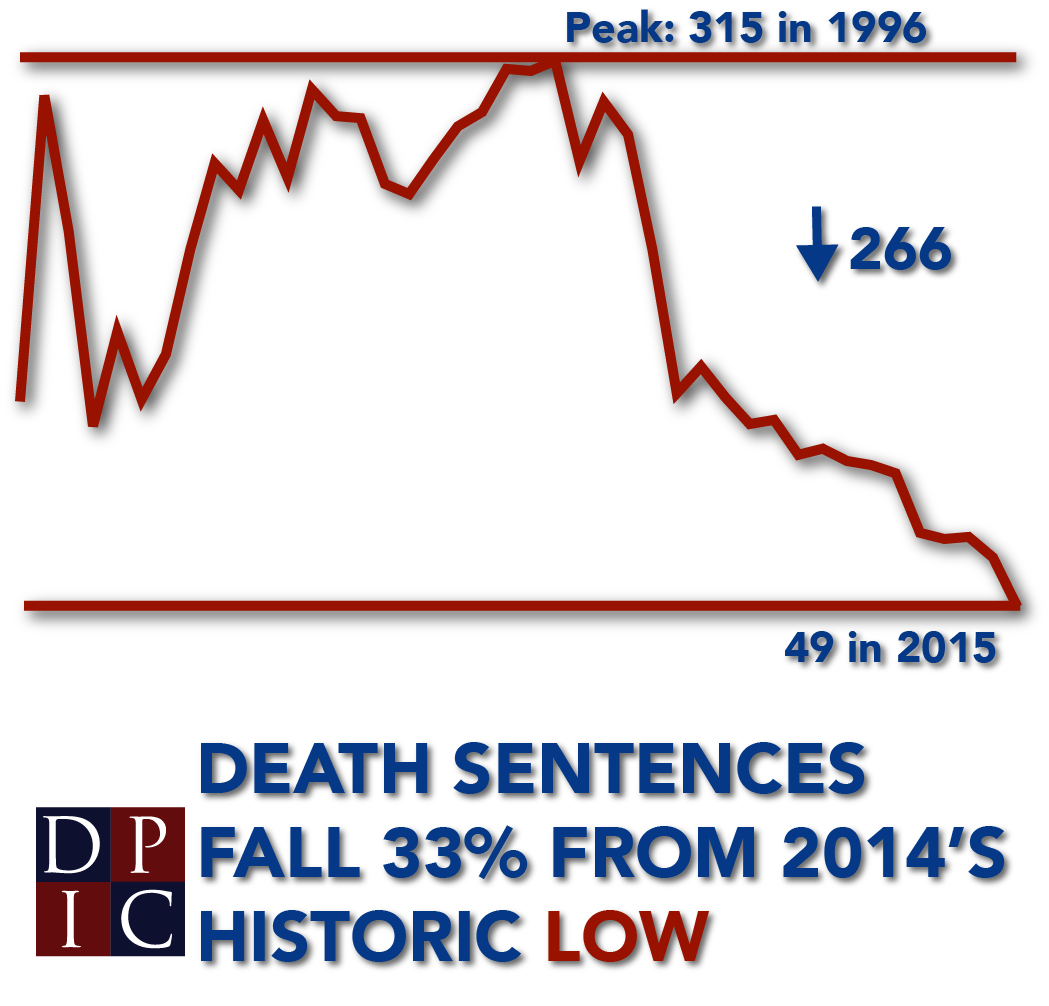
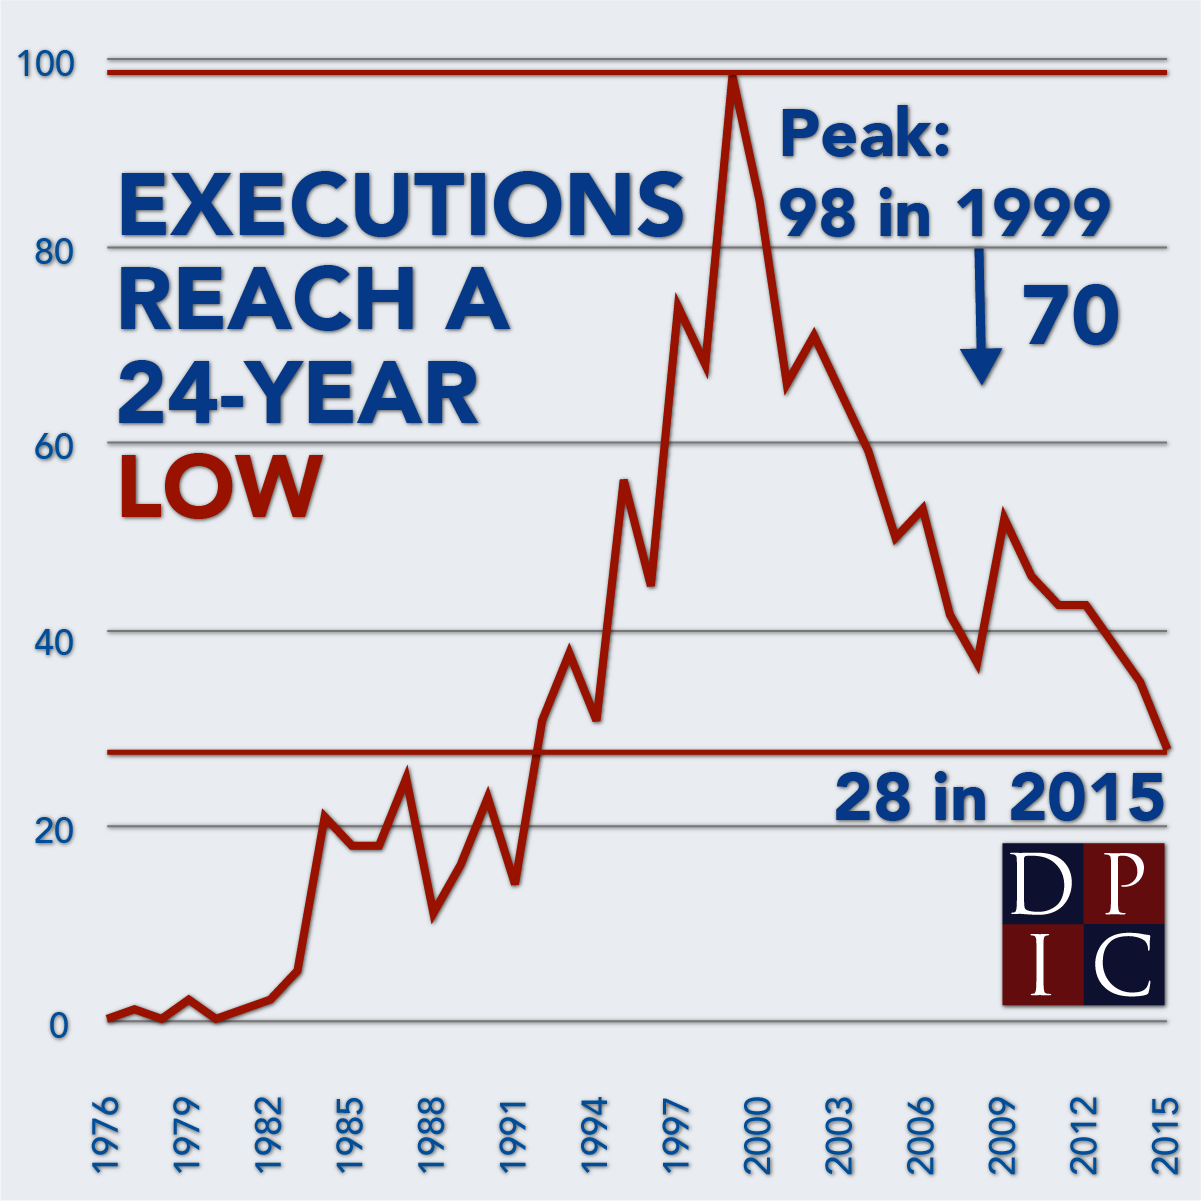
(Washington, D.C.) The use of the death penalty in the U.S. declined by virtually every measure in 2015. The 28 executions this year marked the lowest number since 1991, according to a report released today by the Death Penalty Information Center (DPIC). As of December 15, fourteen states and the federal government have imposed 49 new death sentences this year, a 33% decline over last year’s total and the lowest number since the early 1970s when the death penalty was halted by the U.S. Supreme Court.
Only six states conducted executions this year, the fewest number of states in 27 years. Eighty-six percent of executions this year were concentrated in just three states: Texas (13), Missouri (6), and Georgia (5). Executions in 2015 declined 20 percent from 2014, when there were 35. This year was the first time in 24 years that the number of executions was below 30.
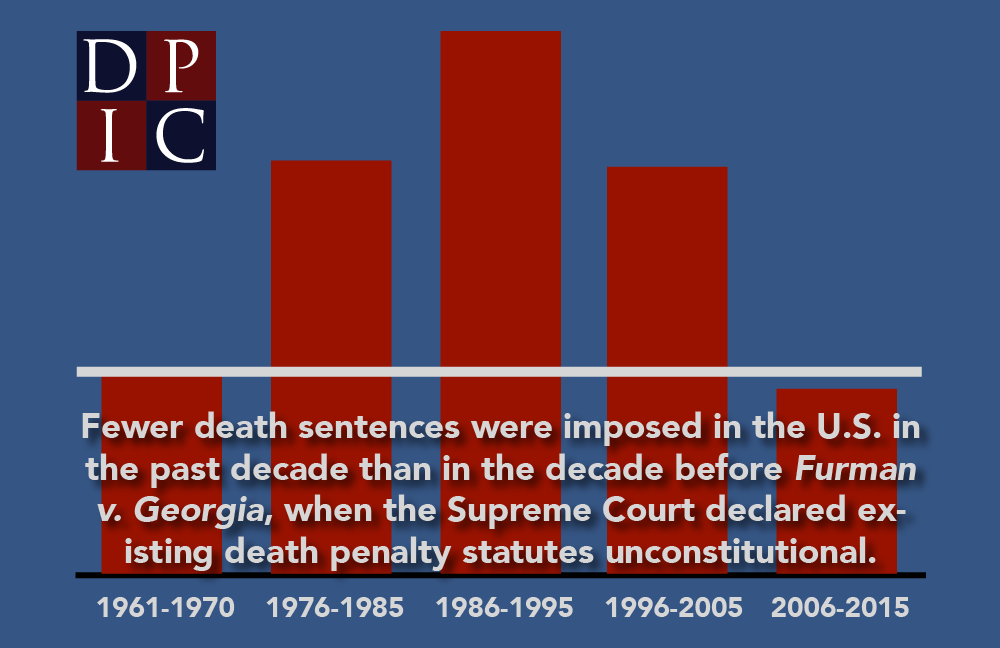
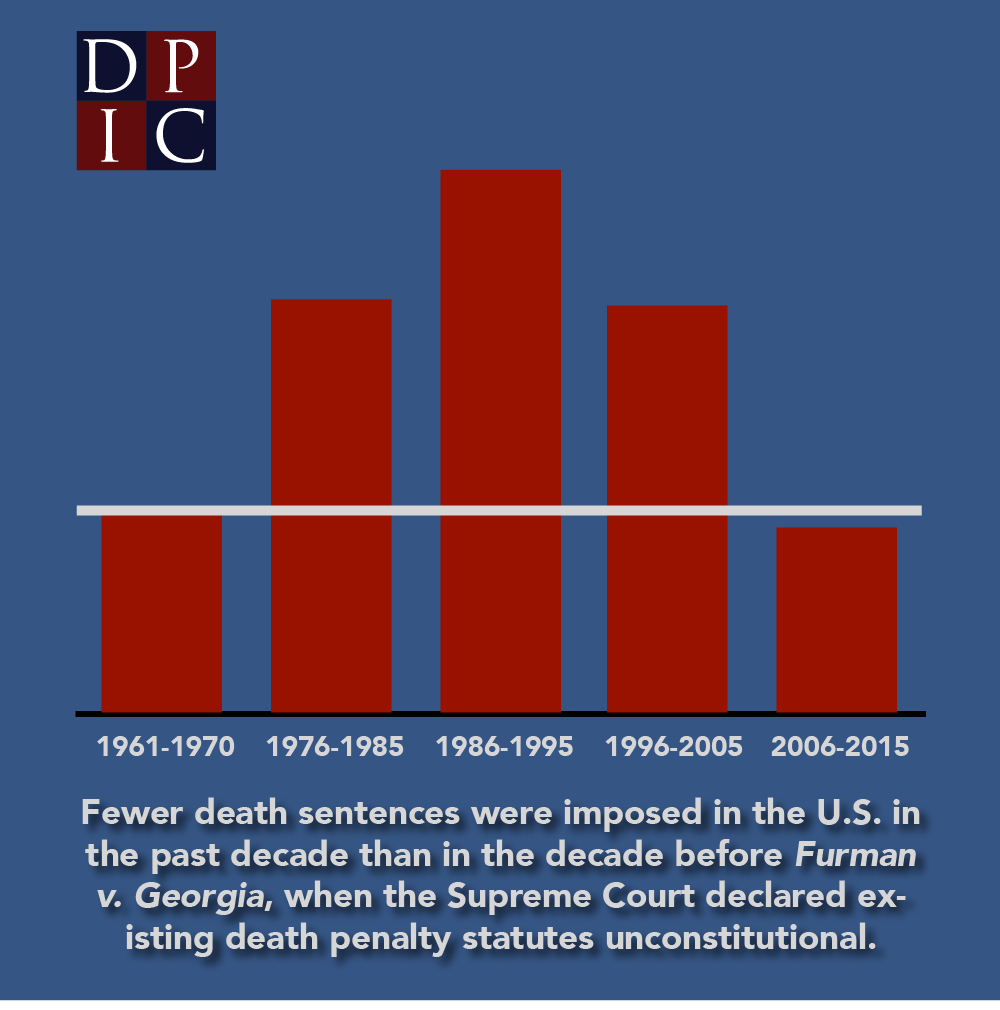
Death sentences have been steadily declining in the U.S. over the past 15 years. The country has now imposed fewer death sentences in the past ten years than in the decade just before the U.S. Supreme Court declared the death penalty unconstitutional in 1972.
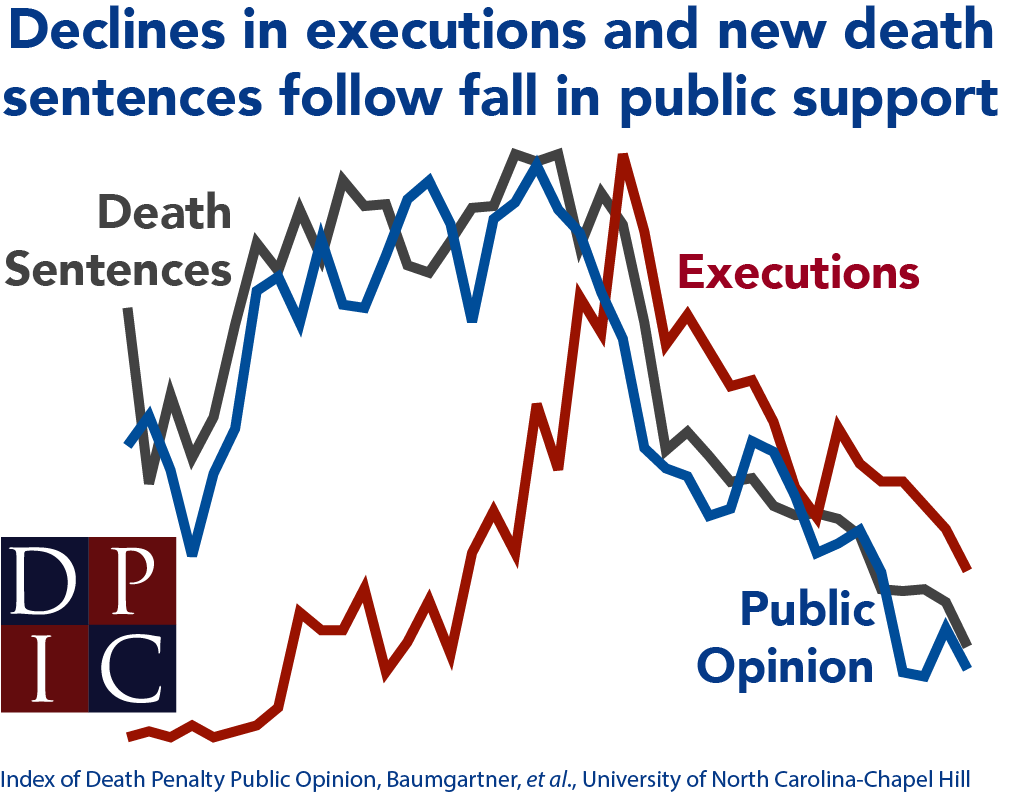
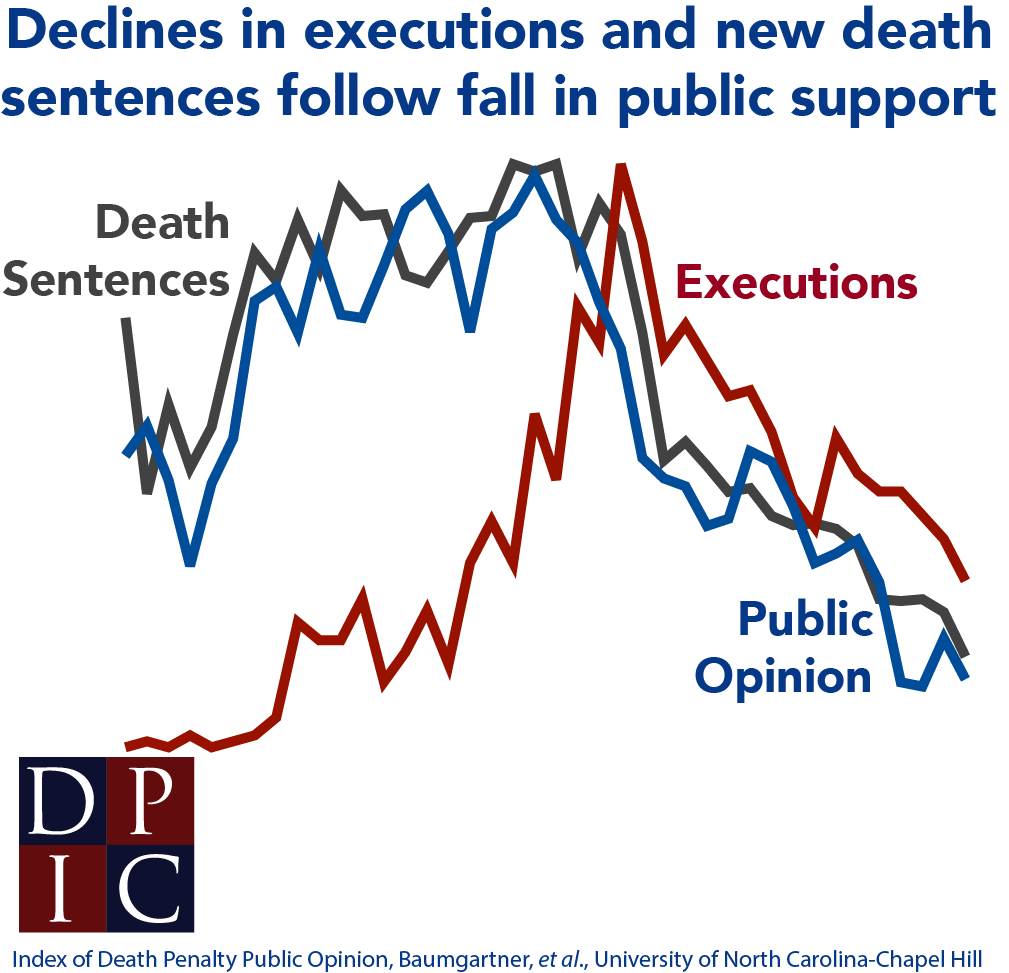
“The use of the death penalty is becoming increasingly rare and increasingly isolated in the United States. These are not just annual blips in statistics, but reflect a broad change in attitudes about capital punishment across the country,” said Robert Dunham, DPIC’s Executive Director and the author of the report. DPIC tracks data on the death penalty, but does not take a position on capital punishment.
Relatively few jurisdictions handed down death sentences in 2015. A single county — Riverside, California — imposed 16% of all death sentences in the U.S., and accounted for more death verdicts than any state, except for Florida. More than a quarter of the death sentences were imposed by Florida and Alabama after non-unanimous jury recommendations of death — a practice barred in all but three states. Texas, by contrast, imposed only two new death sentences in 2015.1 Nearly two-thirds of all new death sentences this year came from the same two percent of U.S. counties that are responsible for more than half of all death-sentenced inmates nationwide.
Read DPIC’s “The Death Penalty in 2015: Year End Report”.
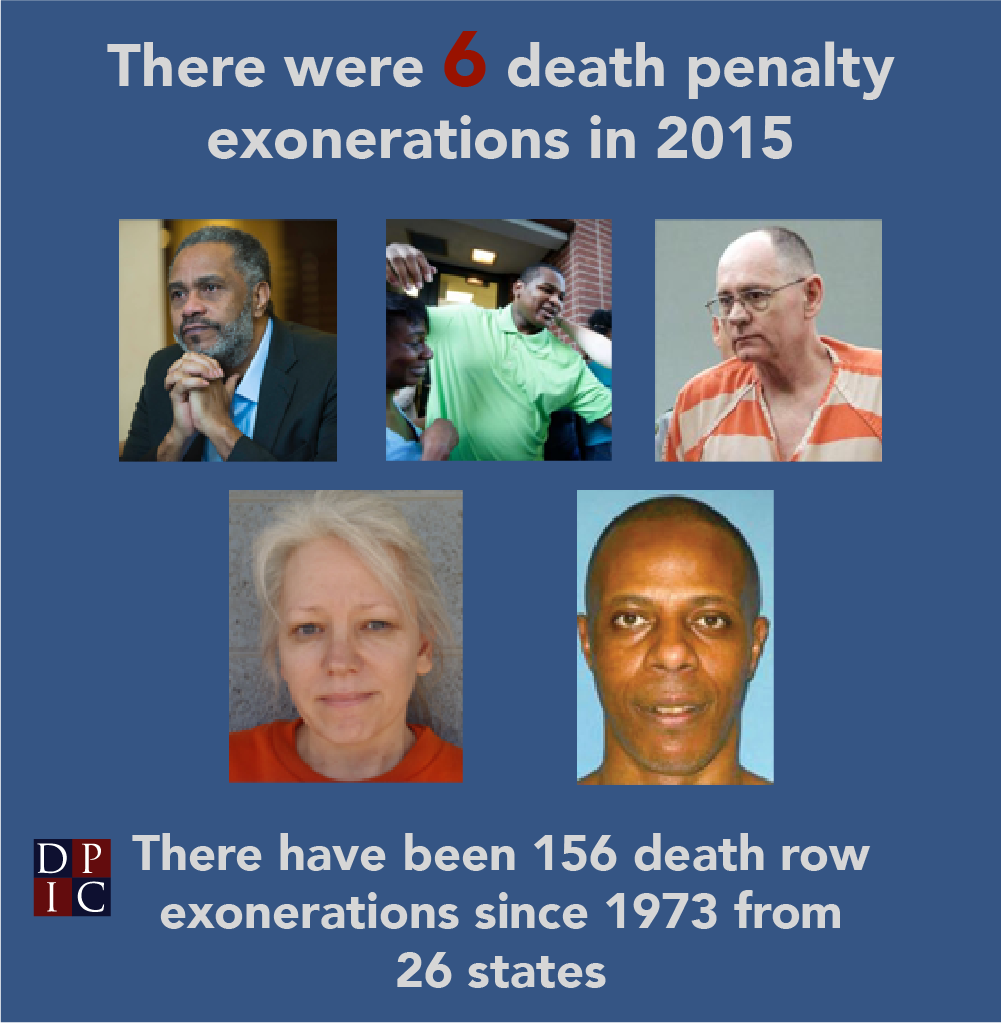
Even as the use of the death penalty declined, its most dangerous flaw remained apparent. Six death row prisoners were exonerated of all charges this year, one each in Alabama, Arizona, Florida, Georgia, Mississippi, and Texas. Since 1973, a total of 156 inmates have been exonerated and freed from death row.
The number of people on death row dropped below 3,000 for the first time since 1995, according to the latest survey by the NAACP Legal Defense Fund.
At least 70 death row prisoners with execution dates in 2015 received stays, reprieves, or commutations, 2.5 times the number who were executed.
In addition, there is an ongoing risk that judicial review is inadequate to protect capital defendants with serious intellectual disabilities or crippling mental illness. DPIC’s report states: “The death penalty is supposed to be reserved for the worst of the worst crimes and the worst of the worst offenders. However, … [t]wo-thirds of the 28 people executed in 2015 exhibited symptoms of severe mental illness, intellectual disability, the debilitating effects of extreme trauma and abuse, or some combination of the three.”
###
The Death Penalty Information Center is a non-profit organization serving the media and the public with analysis and information on issues concerning capital punishment. DPIC was founded in 1990 and prepares in-depth reports, issues press releases, conducts briefings for the media, and serves as a resource to those working on this issue.
- A Texas-specific report is being released by another organization: see “Texas Death Penalty Developments in 2015: The Year in Review”.
INFOGRAPHIC: “The Death Penalty in the U.S.” Top

GRAPHICS FOR SOCIAL MEDIA Top
(Right click on “Download” and select “Save Linked File” or “Save Target File”)

Twitter: Download (PNG)
Facebook: Download (PNG)

Twitter: Download (PNG)
Facebook: Download (PNG)

Twitter: Download (PNG)
Facebook: Download (PNG)

Twitter: Download (PNG)
Facebook: Download (PNG)

Twitter: Download (PNG)
Facebook: Download (PNG)
2015 SENTENCING DATA Top
See 2015 Sentencing Data by Name, Race, and County.