The Death Penalty in 2017: Year End Report
Posted on Dec 14, 2017
- PRESS RELEASE
- INFOGRAPHIC: "The Death Penalty in the U.S."
- AUDIO CLIPS
- GRAPHICS
- 2017 Sentencing Data

PRESS RELEASE Top
FOR IMMEDIATE RELEASE
U.S. Sees Second Fewest Death Sentences and Executions in 25 Years
Public Support for Death Penalty Drops to 45-Year Low as Four More Death-Row Prisoners Exonerated in 2017
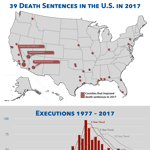
(Washington, D.C.) Executions and death sentences remained near historically low levels in 2017, as public support for the death penalty fell to its lowest level in 45 years, according to a report released today by the Death Penalty Information Center (DPIC). Eight states carried out 23 executions, half the number of seven years ago, and the second lowest total since 1991. Only the 20 executions in 2016 were lower. Fourteen states and the federal government are projected to impose 39 new death sentences in 2017, the second lowest annual total since the U.S. Supreme Court declared the death penalty unconstitutional in 1972. It was the seventh year in a row that fewer than 100 death sentences were imposed nationwide.
“The Death Penalty in 2017: Year End Report” is available at: https://deathpenaltyinfo.org/YearEnd2017.
“Perhaps more than any place else, the changes in Harris County, Texas are symbolic of the long-term change in capital punishment in the United States. For the first time since 1974, the county that has carried out more executions than any other did not execute any prisoner or sentence any defendant to death,” said Robert Dunham, DPIC’s Executive Director.
“Across the political spectrum, more people are coming to the view that there are better ways to keep us safe than executing a handful of offenders selected from a random death-penalty lottery. There will be times when numbers fluctuate – particularly following historic highs or lows – but the steady long-term decline in the death penalty since the 1990s suggests that in most of the country, the death penalty is becoming obsolete,” Dunham said. DPIC provides information and analysis and tracks data on the death penalty, but does not take a position for or against capital punishment.
The new death sentences imposed in 2017 highlight the increasing geographic isolation and arbitrary nature of the death penalty, Dunham said. “By themselves, three outlier counties – Riverside, CA; Clark, NV; and Maricopa, AZ – were responsible for more than 30% of all the death sentences imposed nationwide. The other 3,140 counties and parishes imposed fewer new death sentences than even last year’s record low.” Riverside imposed five death sentences in 2017, Clark four, and Maricopa three, and no other county imposed as many as two. It was the second time in three years that Riverside sentenced more people to death than any other county.
States scheduled 81 executions in 2017, but 58 of them – more than 70 percent – were never carried out. Nearly 75 percent of executions took place in four states: Texas (7); Arkansas (4); Florida (3); and Alabama (3). But Texas’s state courts stayed seven other executions using new laws to permit those prisoners to obtain judicial review of false or misleading evidence, and its execution total tied 2016 for the fewest conducted by the state since 1996.
Systemic problems with racial discrimination, flawed or fraudulent forensic testimony, poor legal representation, and prosecutorial misconduct contributed to four death-row exonerations in 2017. In one exoneration this year, an African-American man in Louisiana had been convicted of killing his infant son, even though an autopsy showed his son died of natural causes.
Many believe that the risk of executing the innocent is one of the leading factors behind the public’s decrease in support for the death penalty. According to the Gallup poll, public support for the death penalty dropped by five percent in 2017, and Republicans registered a 10-percentage point drop since last year. This year’s 55 percent support marks the lowest level since 1972, just before the U.S. Supreme Court ruled the nation’s death penalty laws unconstitutional.
###
The Death Penalty Information Center (www.deathpenaltyinfo.org) is a non-profit organization serving the media and the public with analysis and information on issues concerning capital punishment. DPIC was founded in 1990 and prepares in-depth reports, issues press releases, conducts briefings for the media, and serves as a resource to those working on this issue.
INFOGRAPHIC: “The Death Penalty in the U.S.” Top
AUDIO CLIPS Top
| Clip | Clip Transcript |
|---|---|
| All Clips | |
| Introduction | This is Robert Dunham, Executive Director of the Death Penalty Information Center. The Death Penalty Information Center is a national, non-profit organization that provides information and analysis on death-penalty issues. We don’t take a position for or against the death penalty itself. |
| Highlights | Here are some highlights of the 2017 Year-End Review from the Death Penalty Information Center. |
| Overview | Executions and new death sentences were near historic lows in 2017, and public support for the death penalty polled at its lowest level in 45 years. Both the 23 executions and the projected 39 new death sentences in 2017 were the second lowest totals in more than a quarter-century. |
| Trends | There has been a steady long-term decline in the death penalty since the 1990s, and in most of the country, the death penalty is becoming obsolete. |
| Counties and Death Row | 80% of the counties in the U.S. don’t have anyone on death row. 85% have never executed anyone. More than 99% of U.S. counties didn’t sentence anyone to death in 2017. And for 99.9% of the counties in the country, fewer death sentences were imposed this year than in any other year since the death penalty was brought back in the 1970s. |
| Public Support | According to the Gallup poll, public support for the death penalty was the lowest its been in 45 years. It dropped five percentage points in just one year, and support for death penalty among Republicans fell 10 percentage points. |
| Randomness | We’ve long said that the death penalty is a random lottery that largely depends on the whims of the county prosecutor where the murder takes place. This year’s numbers back that up. There were no death sentences in 99% of the counties in the country and just 3 counties — Riverside, California; Clark, Nevada; and Maricopa, Arizona — accounted for more than 30% of all the death sentences across the entire country. 2017 had the second fewest death sentences of any year since 1973. And except for those three counties, it would have been the fewest. |
| New Sentences |
We project that by the end of the year, there will have been 39 new death sentences in 2017. This will be the seventh year in a row America has imposed fewer than 100 death sentences. |
| Executions | There were 23 executions in 2017. That’s the second fewest in a quarter century, and it’s half the number that were carried out only seven years ago. |
| Execution Dates | Most people think that an execution date means that a defendant is going to be executed. But more than 70% of the executions scheduled for this year were never carried out. |
| Houston, Texas |
Houston, Texas is symbolic of the change in capital punishment in the United States. Houston, which is in Harris County, has executed more prisoners than any other county, but this year — for the first time in more than 40 years — Harris didn’t execute any prisoner and didn’t sentence any defendant to death. |
| Texas | Texas had the most executions in the U.S. in 2017, with 7. That’s the same number as last year, and both year’s totals tied for the fewest executions that the state has carried out since 1996. Texas is another example of the death penalty on the decline. |
| Riverside County California | Riverside County, California imposed more death sentences than any other county in the country this year. That’s the second time in three years that this has been the case, and over the past five years, Riverside has imposed more death sentences than anybody else. Four other southern California counties also rank among the ten highest death-sentencing counties over that same time period. |
| Riverside, Clark, and Maricopa Counties | Just three counties — Riverside, California; Clark, Nevada; and Maricopa, Arizona — imposed more than 30% of all the death sentences in the United States this year. |
| SLATE: Exonerations | Exonerations |
| Four Exonerations in 2017 | Four more death-row prisoners were exonerated in 2017. That brings the total to 160 since 1973. These cases once again involved systemic problems such as racial discrimination, flawed or fraudulent forensic testimony, poor legal representation, and prosecutorial misconduct. In one case — a racially charged case in Louisiana — an African-American man was convicted of killing his infant son, even though an autopsy showed the baby had actually died of natural causes. |
| SLATE: Problematic Executions | Problematic executions |
| Probematic Executions |
The 23 executions carried out in 2017 continue to highlight systemic problems that have long plagued America’s death penalty. 90% of these cases presented significant evidence of mental illness, intellectual disability, brain damage, severe trauma, or innocence. And four prisoners were executed despite substantial concerns about their guilt. |
| Conclusions | The cases from 2017 show us that the length of time cases remain in the courts tells us very little about the quality of death-penalty appeals. Prisoners continue to be executed despite serious concerns about inadequate representation and insufficient judicial review. |
GRAPHICS Top


2017 Sentencing Data Top
2017 Death Sentences by Name, Race, and County