The Death Penalty in 2018: Year End Report
Posted on Dec 14, 2018
- PRESS RELEASE
- INFOGRAPHIC: "The Death Penalty in the U.S."
- GRAPHICS
- 2018 SENTENCING DATA
- 2018 EXECUTION DATA
- NOTE

PRESS RELEASE Top
FOR IMMEDIATE RELEASE
2018 Marked the Fourth Consecutive Year with Fewer than 30 Executions and Less than 50 Death Sentences
Washington State Becomes 20th State to End Capital Punishment
(Washington, D.C.) With 25 executions and 42 death sentences expected this year, the use of the death penalty remained near historic lows in 2018, according to a report released today by the Death Penalty Information Center (DPIC). 2018 marked the fourth consecutive year with fewer than 30 executions and 50 death sentences, reflecting a long-term decline of capital punishment across the United States. Court decisions and election results signaled continuing low death-penalty use as Washington State declared its capital punishment statute unconstitutional and voters ousted prosecutors in seven counties known for aggressive death-penalty usage.
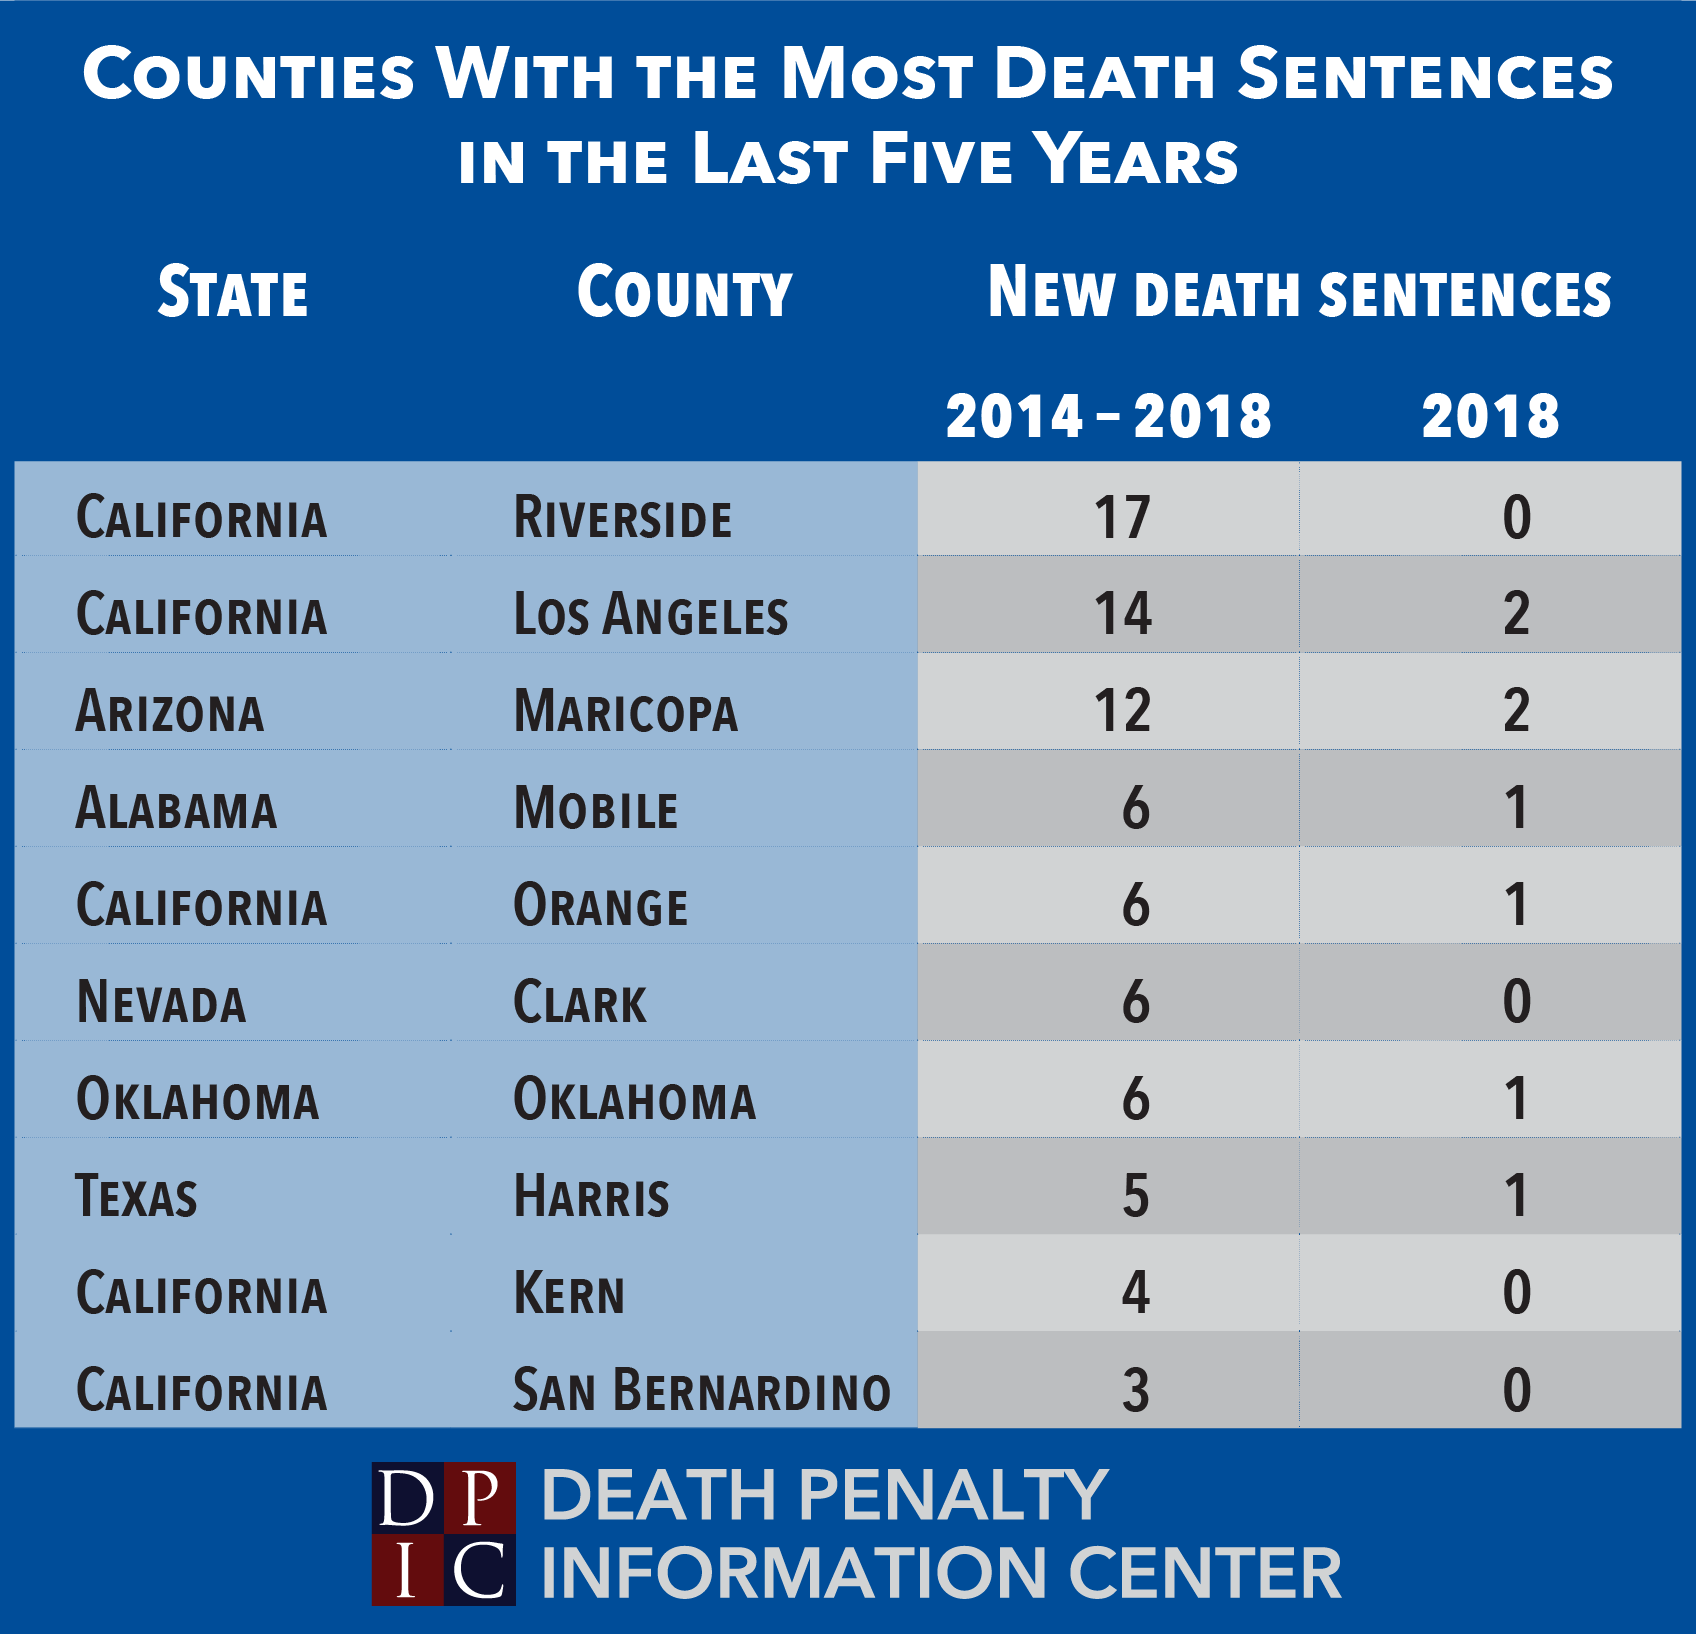
In 2018, 14 states and the federal government imposed death sentences, with 57% of the projected 42 sentences coming from just four states: Texas and Florida (both with seven) and California and Ohio (both with five). No county imposed more than two death sentences for the first time in the modern era of the death penalty (after the U.S. Supreme Court struck down all death penalty statutes in 1972).
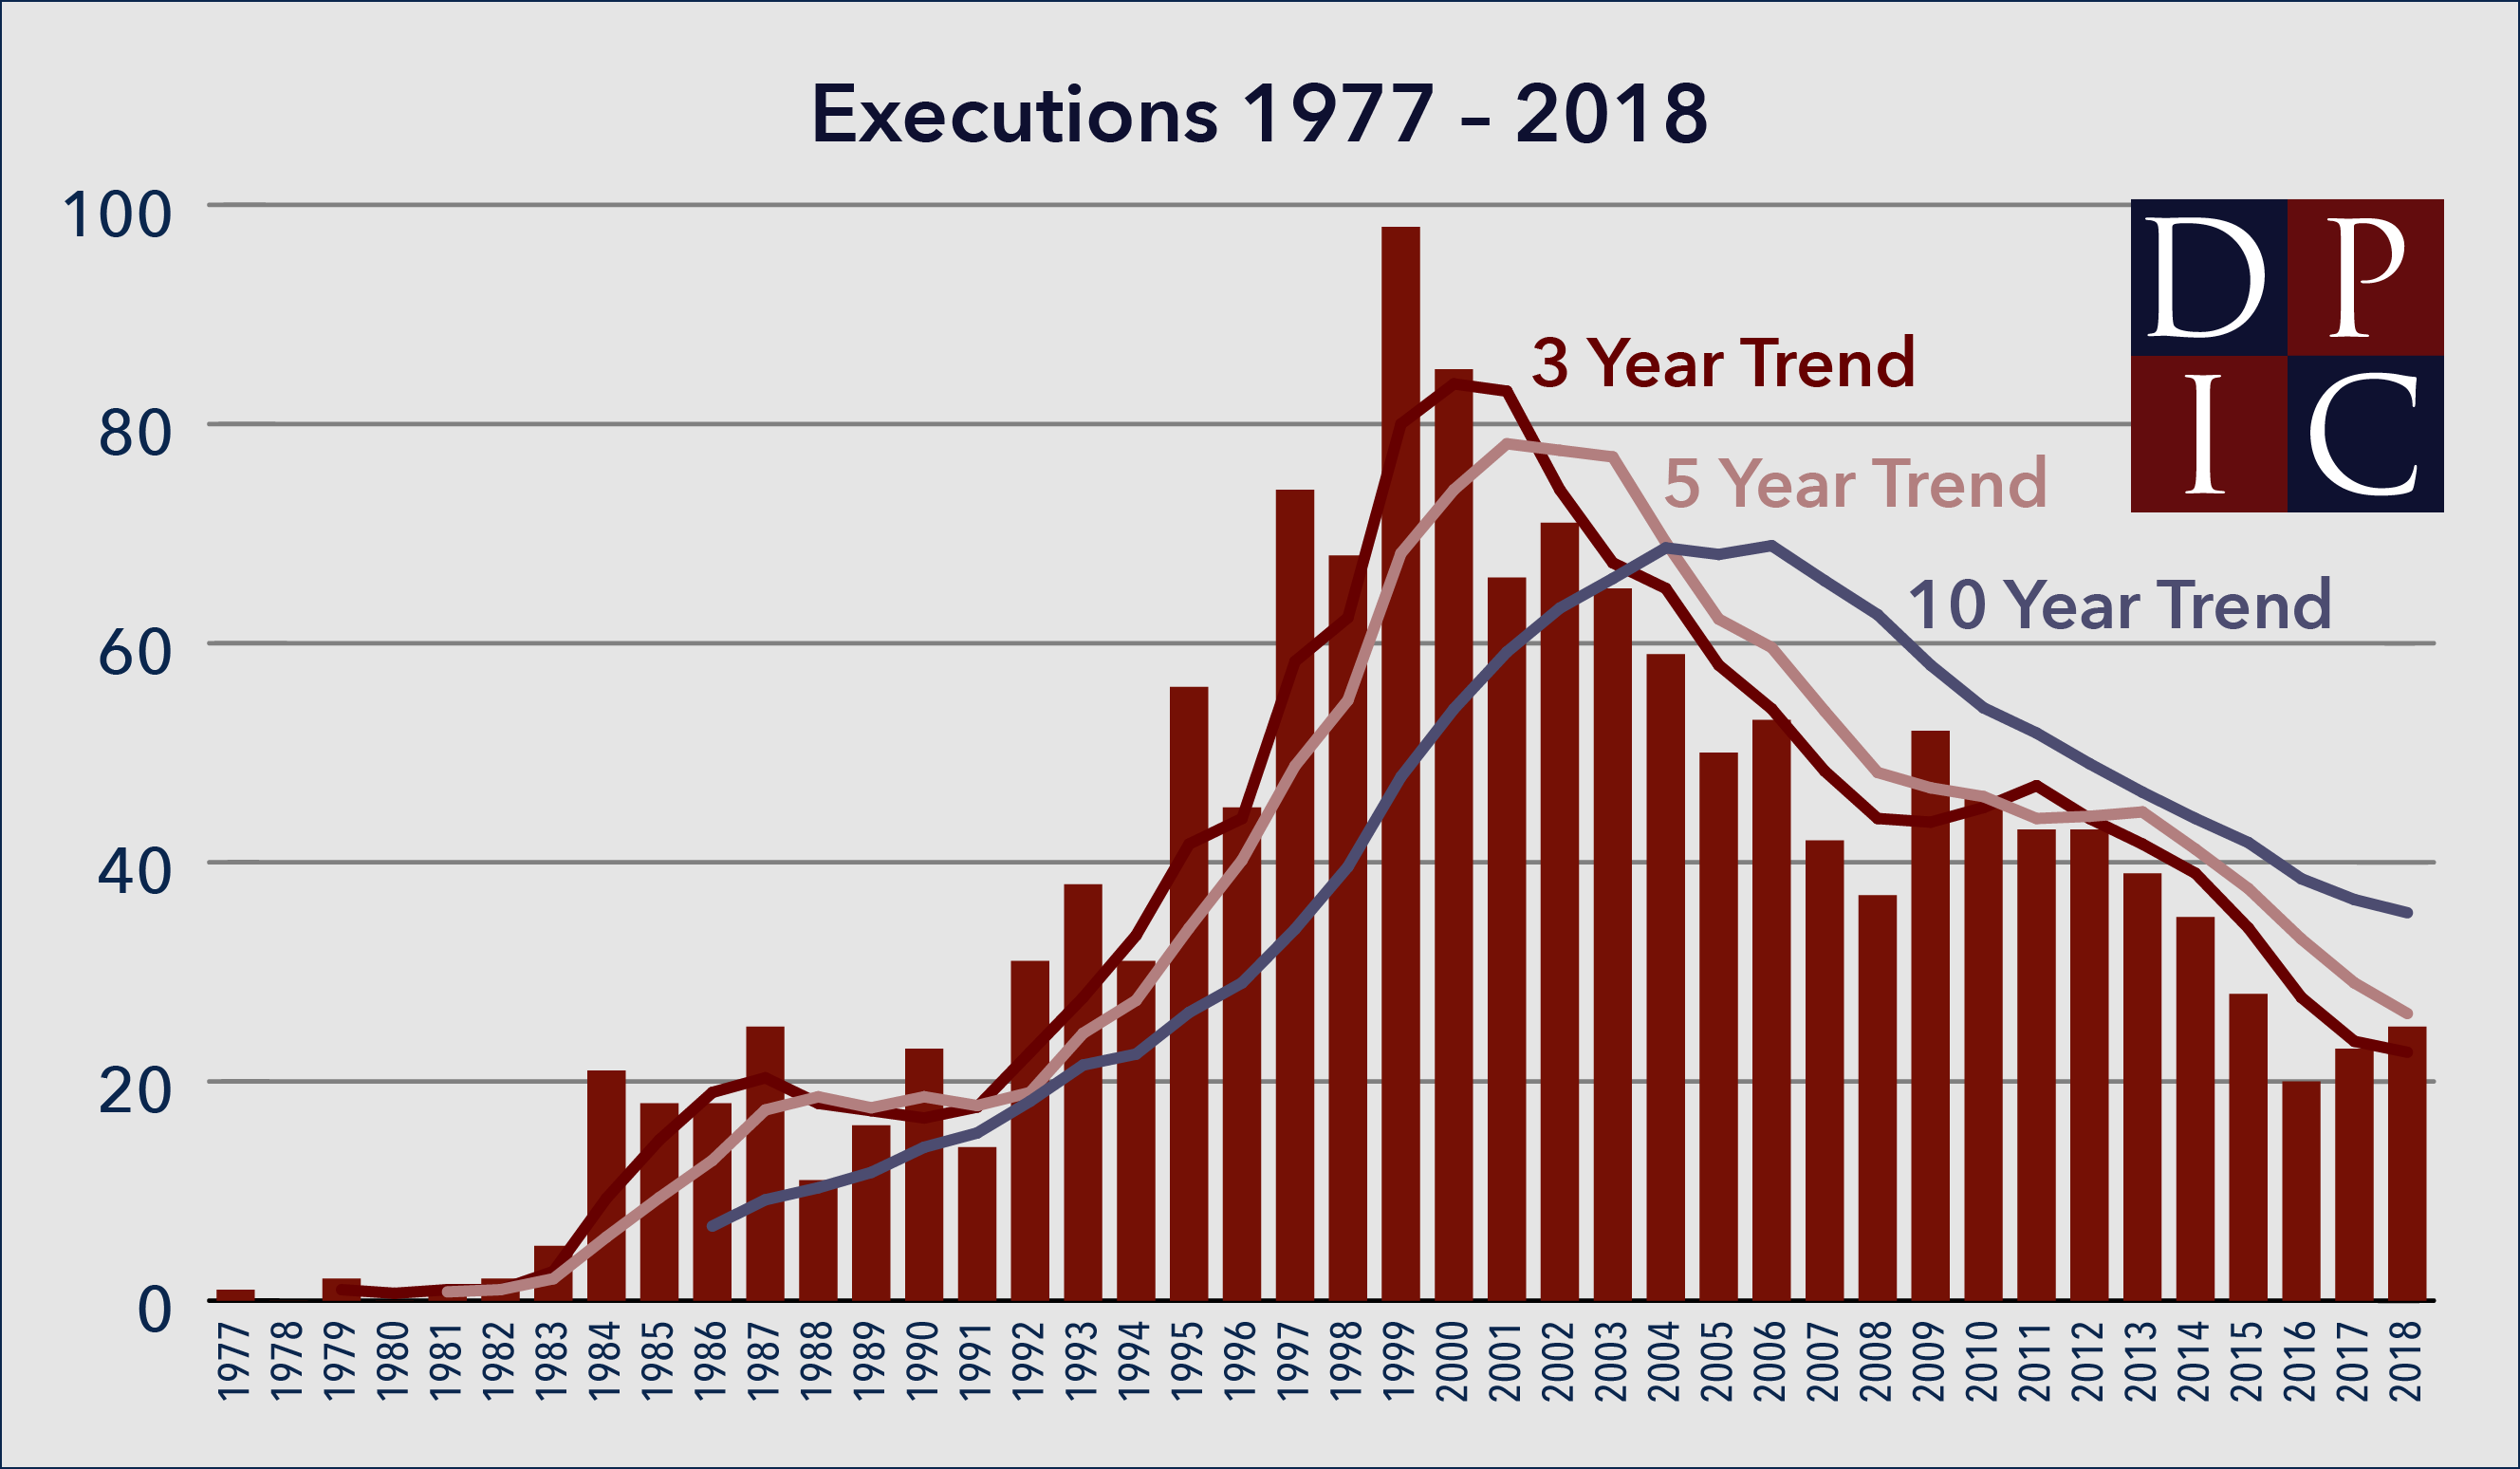
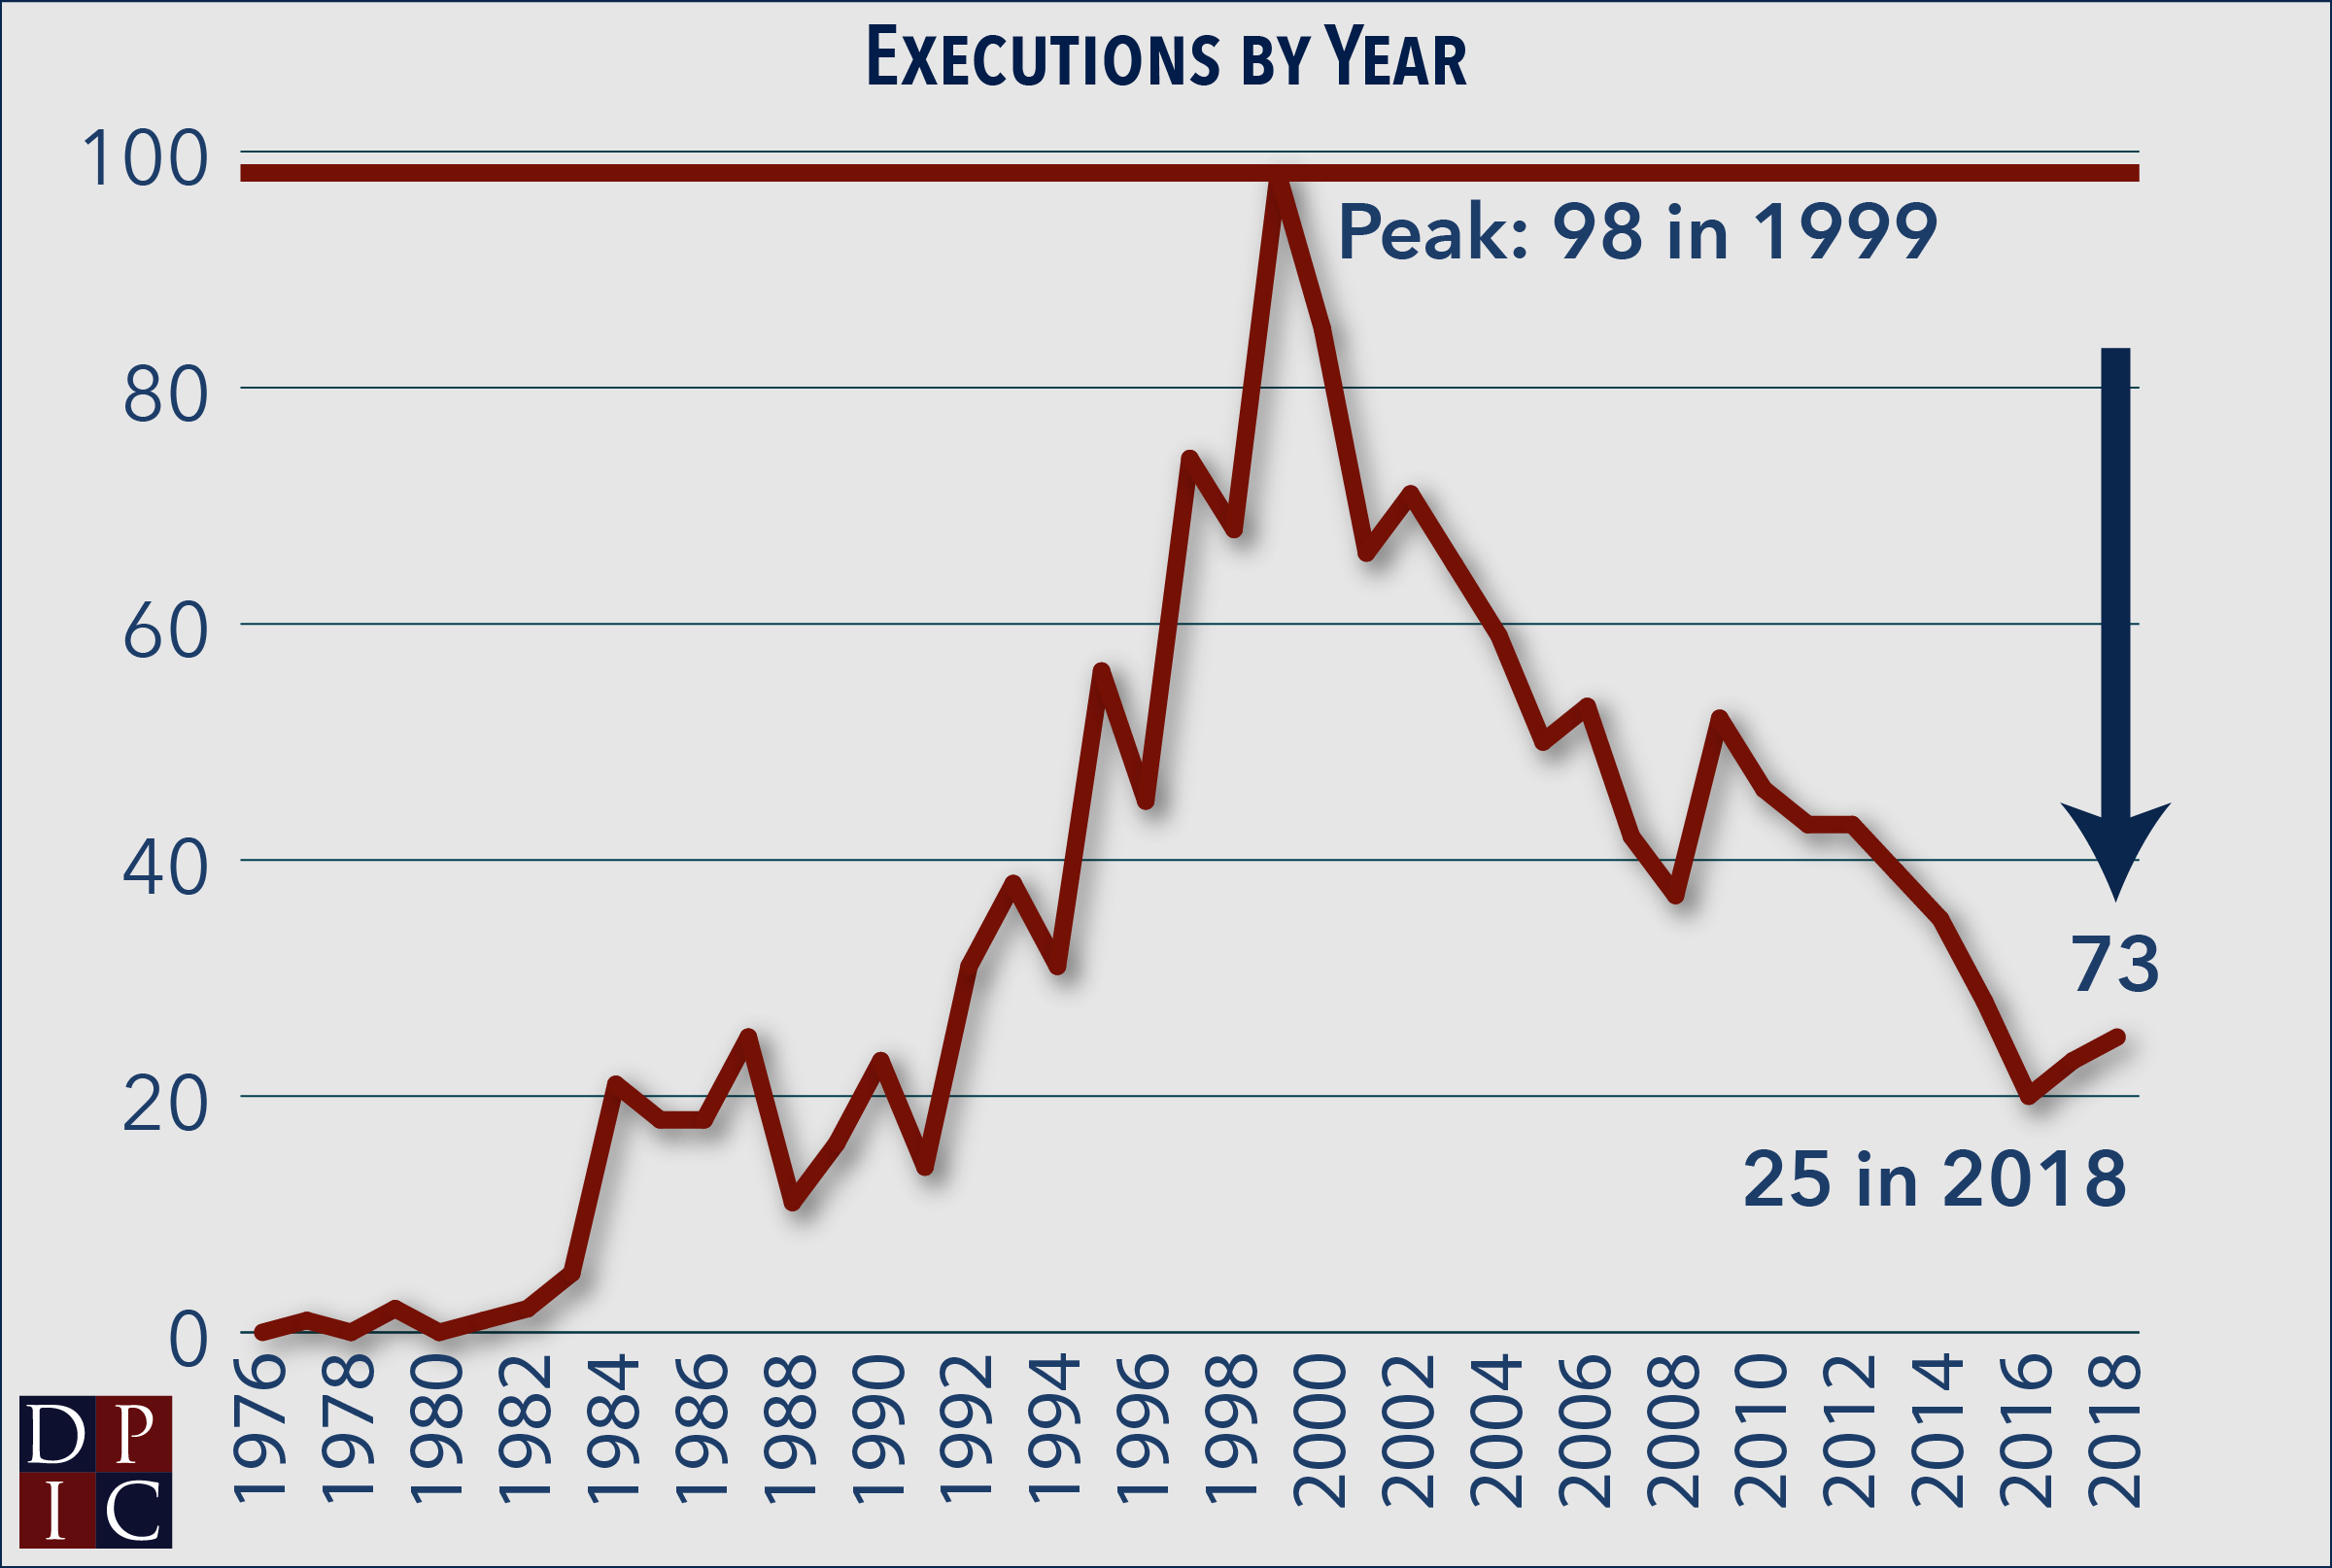
The death penalty remained geographically isolated as only eight states carried out the 25 executions: Alabama, Arkansas, Florida, Georgia, Nebraska, South Dakota, Tennessee, and Texas. Texas accounted for more than half of all executions (13); there were fewer executions in the rest of the country than in any year since 1991. 2018 was the fourth year in a row with fewer than 30 executions. Before 2015, 1991 was the last year with fewer than 30 executions.
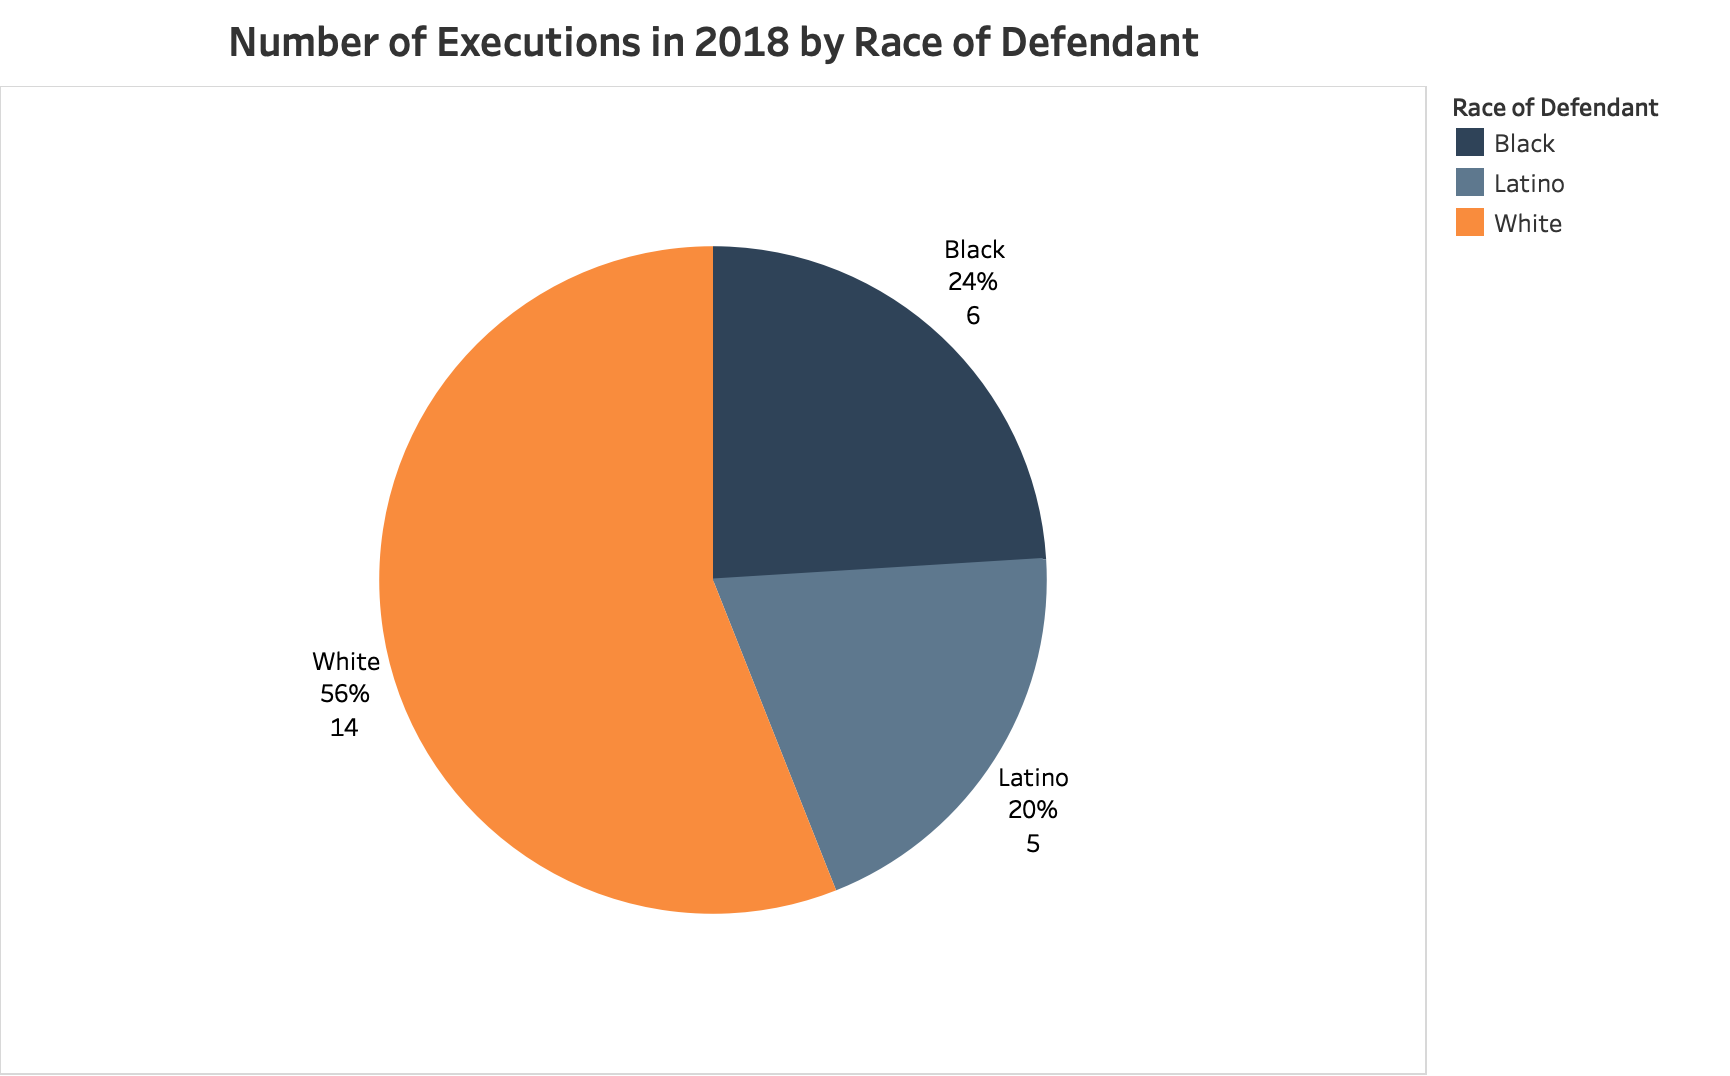
The cases in which the death penalty was imposed or carried out continued to raise questions about the fairness of its application. More than 70% of the people executed showed evidence of serious mental illness, brain damage, intellectual impairment, or chronic abuse and trauma, and four were executed despite substantial innocence claims.
“America continued its long-term movement away from the death penalty in 2018,” said Robert Dunham, DPIC’s Executive Director. “Even in the face of inflammatory political rhetoric urging its expanded use, voters showed that the death penalty is no longer a political wedge issue. The reelection of governors who imposed death penalty moratoria, the replacement of hardline pro-death-penalty prosecutors with reformers, and Washington’s court decision striking down its death penalty suggest that we will see even greater erosion of the death penalty in the years ahead.” DPIC provides information, analysis, and data on the death penalty but does not take a position for or against capital punishment.
On October 11, Washington became the 20th state to abolish the death penalty when its Supreme Court unanimously ruled that capital punishment violates the state constitution because it “is imposed in an arbitrary and racially biased manner.” Governors in Oregon and Pennsylvania who had imposed or extended moratoria on the death penalty were reelected and Colorado, the third state with a moratorium, elected a governor who campaigned on repealing the death penalty.
Prosecutorial candidates who ran on reform platforms won elections in several counties with a history of aggressive use of the death penalty. Reform candidates were elected district attorney in two Texas counties – Bexar and Dallas – that are among the two percent of counties responsible for the majority of executions. Voters in Orange and San Bernardino counties in California, two of the nation’s most prolific producers of death sentences, ousted their long-time incumbent district attorneys.
The 2018 Gallup poll found that fewer than half of Americans (49%) now believe that the death penalty is “applied fairly.” This was the lowest level since Gallup began asking the question in 2000. Overall support for the death penalty remained essentially unchanged from 2017’s 45-year low.
In November, DPIC released a comprehensive report, “Behind the Curtain: Secrecy and the Death Penalty in the United States,” showing that, since 2011, 13 states have enacted new secrecy statutes that conceal important information about the execution process. Of the 17 states that have carried out 246 recent lethal-injection executions, all withheld at least some information about the execution process.
To speak with Robert Dunham, DPIC’s Executive Director, please contact Chloe Madvig at cmadvig@deathpenaltyinfo.org or 202 – 289-4022.
###
The Death Penalty Information Center (www.deathpenaltyinfo.org) is a non-profit organization serving the media and the public with analysis and information on issues concerning capital punishment. DPIC was founded in 1990 and prepares in-depth reports, issues press releases, conducts briefings for the media, and serves as a resource to those working on this issue.
INFOGRAPHIC: “The Death Penalty in the U.S.” Top

GRAPHICS Top
(Right click on “Download” and select “Save Linked File” or “Save Target File”)


2018 SENTENCING DATA Top
2018 Death Sentences by Name, Race, and County
2018 EXECUTION DATA Top
Download 2018 Execution Data as a Microsoft Excel file.
NOTE Top
This report was revised in July 2019 when DPIC learned of the death sentence imposed on Keith Barlow in Clark County, Nevada on September 25, 2018.