Executions Overview
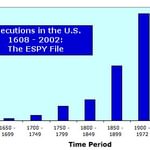
Executions in the U.S. 1608-2002: The Espy File

The “Espy File” is a database of executions in the United States and the earlier colonies from 1608 to 2002. This list of 15,269 executions was compiled by M. Watt Espy and John Ortiz Smykla, and was made available through the Inter-University Consortium for Political and Social Research. Note: This is the latest version of the Espy File. Previously, this web page contained “The Espy File: 1608 – 1987.”
The files below feature important information about each execution listed in the Espy File, such as the name, age and race of each individual executed, the date of execution, and the method of execution used, but omit some information, such as county of execution and the occupation of the executed. To download the complete Espy File, visit the ICPSR website at www.icpsr.umich.edu/NACJD (click “download data” and use ICPSR # 8451). Some information in the Espy File differs slightly from DPI information since 1976, with respect to dates of execution and race of the inmate, but not the names, place or method of execution. In these instances, DPI has verified through Department of Corrections’ websites and news accounts that the information on DPI pages is correct. For information on more recent executions, see DPI’s Information on Executions in the U.S.
Please note that the Espy File is an incomplete work, and that other studies featured on this website may include executions not listed in the Espy File.
DPI’s display of the Espy File data has been sorted in three different ways for convenience in researching: Executions in Chronological Order, Executions in Alphabetical Order by the last name of the defendant, and Executions in Geographical Order, by the state in which the execution was carried out. In all of these files, the location given is not necessarily the jurisdiction responsible for the execution. For example, an execution may have occurred in California but under federal jurisdiction. The location would be listed as CA. Consult the original Espy File database for complete information.
The files are in pdf form and may be read with the free program Adobe Reader.
This information is also available in Excel format.
Historical Leaders in Executions Since 1608
Using information contained in the “Espy File” together with current information, the states in the United States that have executed 700 or more prisoners since 1608 are as follows:
| Espy File 1608 – 1972 | DPI – 2019 | Total 1608 – 2019 | |
|---|---|---|---|
| 1. Virginia | 1,277 | 113 | 1,390 |
| 2. Texas | 755 | 567 | 1,325 |
| 3. New York | 1,130 | 0 | 1,130 |
| 4. Pennsylvania | 1,040 | 3 | 1,043 |
| 5. Georgia | 950 | 75 | 1,026 |
| 6. North Carolina | 784 | 43 | 827 |
| 7. Alabama | 708 | 66 | 775 |
| 8. California | 709 | 13 | 722 |
* Executions as of December 31, 2020
For executions occurring after January 1, 2023, see our Executions Database.
Executions by Race of Defendants: 1608 – 2022
Below is the racial breakdown of people executed from 1608 to 1972, compiled from information found in the “Espy File.” Also shown is the same breakdown since the death penalty was resumed in 1976, compiled from DPI race statistics. For more information, see Race and the Death Penalty.
| Race | Espy File 1608 — 1972 | DPI 1976 — 2022* | Executions 1608 — 2022* |
|---|---|---|---|
| White | 40.7% (5,902) | 55.6% (866) | 42.2% (6,768) |
| Black | 48.9% (7,084) | 34.1% (532) | 47.5% (7,616) |
| Native American | 2.4% (353) | 1.3% (20) | 2.3% (373) |
| Hispanic | 2.0% (295) | 8.3% (130) | 2.6% (424) |
| Other (includes Asian Pacific Islander and unknown) | 5.9% (855) | 0.6% (10) | 5.4% (865) |
| Total Executions | 14,489 | 1,558 | 16,047 |
*Executions through December 31, 2022
Numbers in parenthesis are the actual number of persons of each race executed in the time period.
Executions 1608 – 1976
| State | Executions 1608 – 1976 |
|---|---|
| Virginia | 1,277 |
| New York | 1,130 |
| Pennsylvania | 1,040 |
| Georgia | 950 |
| North Carolina | 784 |
| Texas | 755 |
| California | 709 |
| Alabama | 708 |
| South Carolina | 641 |
| Louisiana | 632 |
| Arkansas | 478 |
| Ohio | 438 |
| Kentucky | 424 |
| New Jersey | 361 |
| Mississippi | 351 |
| Illinois | 348 |
| Massachusetts | 345 |
| Tennessee | 335 |
| Florida | 314 |
| Maryland | 309 |
| Missouri | 285 |
| West Virginia | 155 |
| Oklahoma | 132 |
| Indiana | 131 |
| Connecticut | 126 |
| Oregon | 122 |
| Washington, DC | 118 |
| Washington | 105 |
| Arizona | 104 |
| Colorado | 101 |
| New Mexico | 73 |
| Montana | 71 |
| Minnesota | 66 |
| Delaware | 62 |
| Nevada | 61 |
| Kansas | 57 |
| Rhode Island | 52 |
| Hawaii | 49 |
| Iowa | 45 |
| Utah | 43 |
| Nebraska | 34 |
| Idaho | 26 |
| Vermont | 26 |
| New Hampshire | 24 |
| Wyoming | 22 |
| Maine | 21 |
| South Dakota | 15 |
| Michigan | 13 |
| Alaska | 12 |
| North Dakota | 8 |
| Wisconsin | 1 |