Murder Rates
Murder Rate of Death Penalty States Compared to Non-Death Penalty States
(Data for each year taken from the FBI’s Uniform Crime Reports. Murder rates calculated by dividing the total number of murders by the total population in death penalty and non-death penalty states respectively and multiplying that by 100,000)
* Includes Kansas and New York in the years after they adopted the death penalty, 1994 and 1995 respectively. New York’s death penalty was then declared unconstitutional in 2004, after which it is counted as a non-death penalty state. New Jersey ended the death penalty in the latter part of 2007 and is counted as a non-death penalty state from then on. The Delaware Supreme Court found the Delaware death penalty statute unconstitutional late in 2016 and in early 2017 made that ruling retroactive. From 2017 on Delaware is considered a non-death penalty state. Washington is first counted as a non-death penalty state in 2018. New Hampshire will be counted as a non-death penalty state in 2019. In 2020, governor imposed moratorium was declared in California, Oregon, and Pennsylvania.
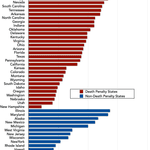
The murder rate in non-death penalty states has remained consistently lower than the rate in states with the death penalty, and the gap has grown since 1990.
Studies Comparing States With the Death Penalty and States Without

Michigan Lawmakers Reaffirm State’s Longstanding Ban on Capital Punishment — In a vote upholding the state’s longstanding abolition of the death penalty, Michigan lawmakers refused to support a measure that would have put capital punishment before state voters in a referendum. The vote fell 18 short of the 2/3 required for passage. During a lengthy House debate regarding the bill, Representative Jack Minor (D‑Flint) told his colleagues that studies show crime rates are lower in states without the death penalty. He noted, “The death penalty’s not a deterrent. In fact, the figures would suggest it’s just the opposite.” Other opponents of the measure stated that “revenge” would not help victims’ families. Michigan has not had the death penalty for 158 years, and voters have not addressed the issue since its abolition was included in the 1963 revision of the state constitution. Michigan is one of 12 states in the U.S. that does not have a death penalty. (Michigan Live, March 19, 2004) The state was the first English speaking government in the world to ban the practice.
States Without the Death Penalty Have Better Record on Homicide Rates — A new survey by the New York Times found that states without the death penalty have lower homicide rates than states with the death penalty. The Times reports that ten of the twelve states without the death penalty have homicide rates below the national average, whereas half of the states with the death penalty have homicide rates above. During the last 20 years, the homicide rate in states with the death penalty has been 48% — 101% higher than in states without the death penalty. “I think Michigan made a wise decision 150 years ago,” said the state’s governor, John Engler, a Republican, referring to the state’s abolition of the death penalty in 1846. “We’re pretty proud of the fact that we don’t have the death penalty.” (New York Times, 9/22/00)
States Without the Death Penalty Fared Better Over Past Decade — In the past ten years, the number of executions in the U.S. has increased while the murder rate has declined. Some commentators have maintained that the murder rate has dropped because of the increase in executions (see, e.g., W. Tucker, “Yes, the Death Penalty Deters,” Wall St. Journal, June 21, 2002). However, during this decade the murder rate in non-death penalty states has remained consistently lower than the rate in states with the death penalty.
When comparisons are made between states with the death penalty and states without, the majority of death penalty states show murder rates higher than non-death penalty states. The average of murder rates per 100,000 population in 1999 among death penalty states was 5.5, whereas the average of murder rates among non-death penalty states was only 3.6.
Notes:
- Populations are from the U.S. Census estimates for each year.
- Murder rates are from the FBI’s “Crime in the United States” and are per 100,000 population.
- The murder rate for the region (death penalty states or non-death penalty states) is the total number of murders in the region divided by the total population (and then multiplied by 100,000)
- In calculations that include Kansas and New York, Kansas is counted as a death penalty state from 1994 and New York from 1996, since New York’s law did not become effective until September, 1995.