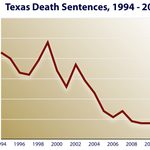
Since the 1990s, almost every death penalty state has experienced a dramatic decline in its annual number of death sentences. DPIC has prepared a series of graphs illustrating this trend in each state: State Death Sentences by Year. This page contains graphs showing the annual number of new sentences in each state between 1994 and 2012. These same graphs can be found individually on each state’s State Information page. Nationally, there was a 75% decrease in new death sentences between 1994 and 2012. Using the same years of comparison, death sentences in Texas and Virginia (the two leading states in executions since 1976) have shown a similar decline. Between 1994 and 2012, Texas death sentences declined by 79%; Virginia death sentences dropped to 0 in 2012, a 100% decline from 1994, when there were 10. In the same time period, Alabama sentences dropped 75%, Florida-44%, Oklahoma-92%, and California-41%.
(State Death Sentences by Year, DPIC posted, April 2, 2013). See Sentencing and States. Read more about the latest death penalty trends in DPIC’s 2012 Year End Report.
Sentencing Data
Jul 21, 2023

Texas Jury Sentences ex-USBP Agent Who Committed Two Murders to Life Without Parole Instead of Death
Studies
Feb 28, 2023

NEW RESOURCES: Interactive Display Illustrates Conditions on Death Row
Sentencing Data
Sep 14, 2022