
On the 50th anniversary of the U.S. Supreme Court’s June 29, 1972 decision in Furman v. Georgia that struck down all existing death penalty laws, the Death Penalty Information Center released its Death Penalty Census.
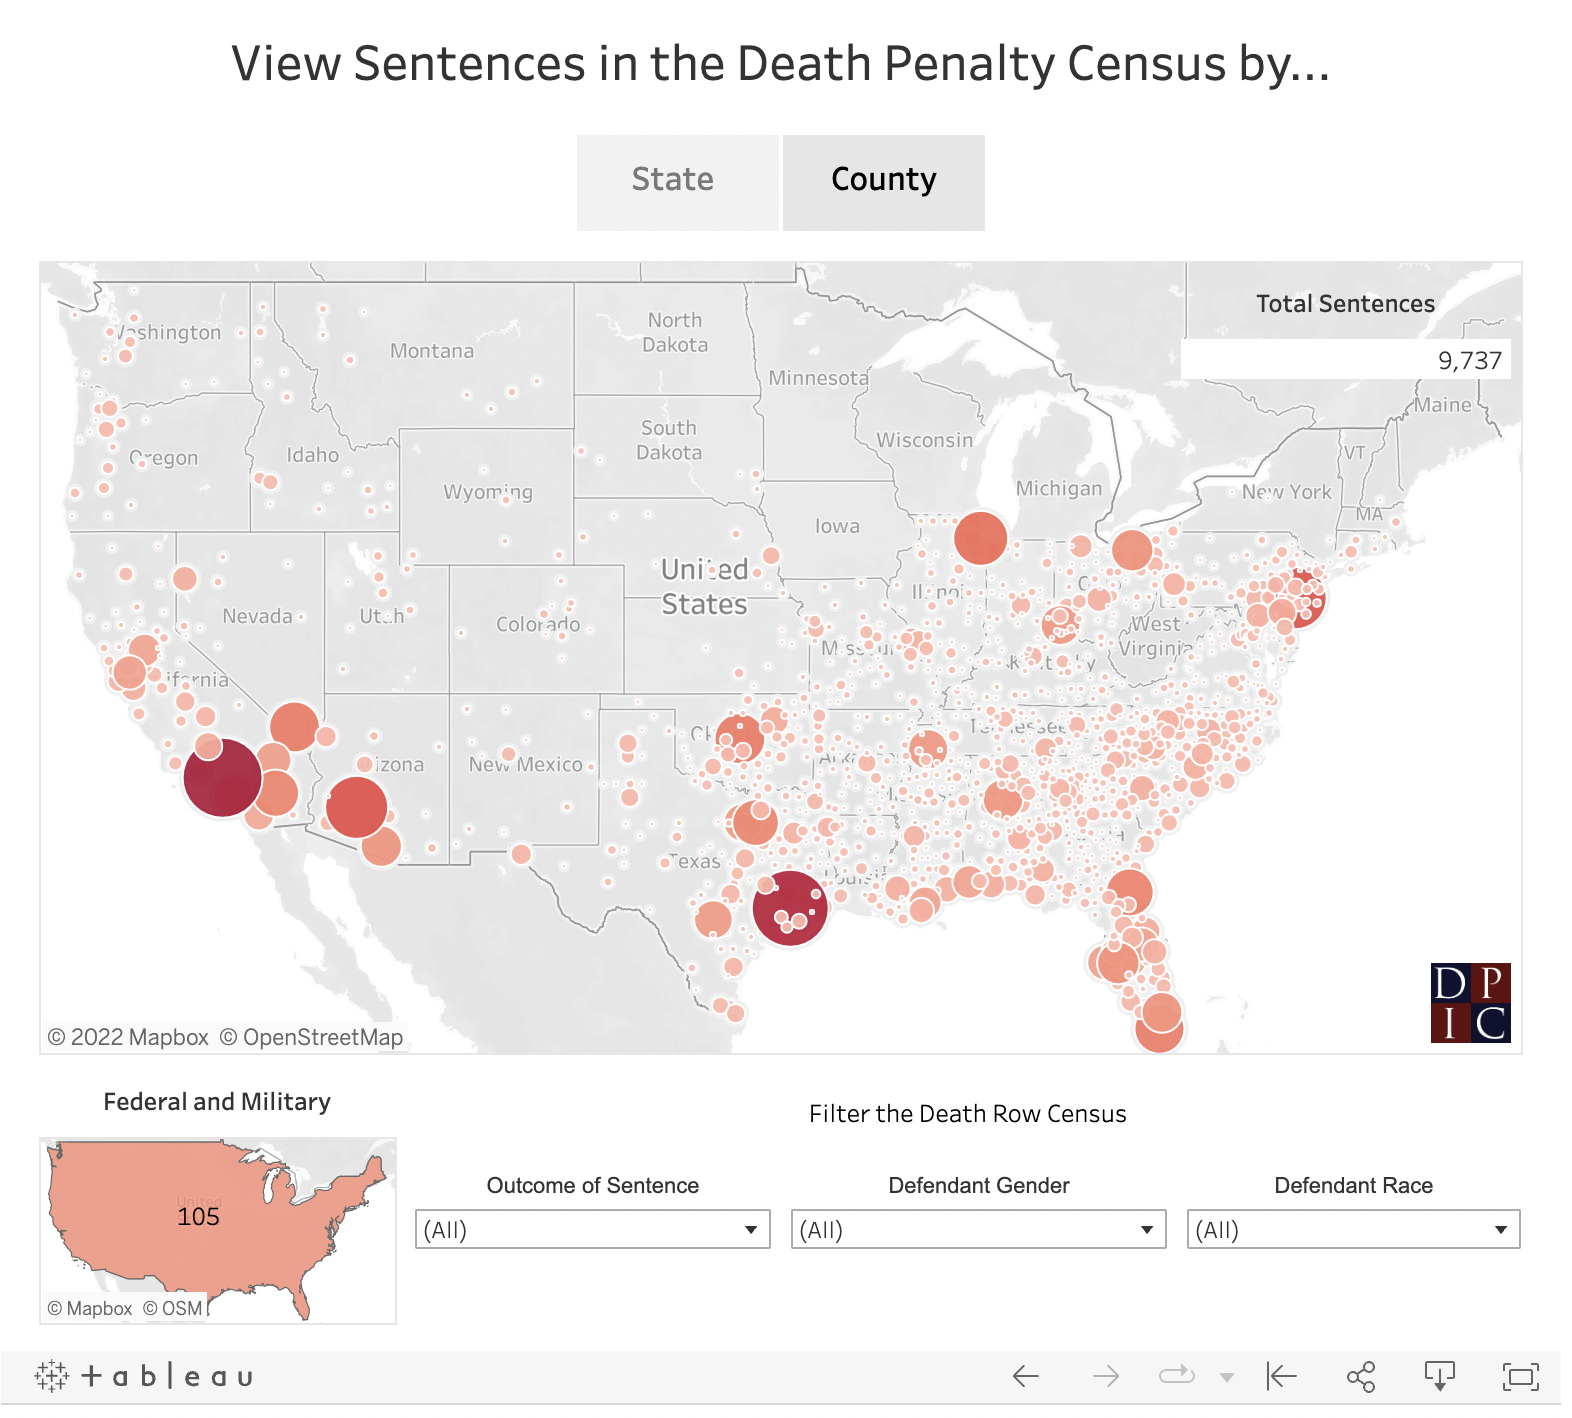
The census is the most comprehensive database of death sentences ever assembled, containing more than 9,700 death sentences (click to enlarge image). In the census, DPIC has attempted to identify every death sentence handed down in the U.S. from the day Furman was decided through January 1, 2021 and track the status of each sentence.
The data provide powerful evidence that the nation’s use of capital punishment continues to be arbitrary, discriminatory, and rife with error.
“After 50 years, the data show a wasteful punishment, incompetently applied and beset by arbitrary factors such as race, place, and time,” said Robert Dunham, DPIC’s Executive Director. “The most likely outcome of a death sentence once it is imposed is that it will be overturned. Fewer than 1.1% of counties account for half of death row. Thirty-year-old cases are coming up for execution that wouldn’t even be capitally prosecuted today. And when you look behind the data, the features that best characterize executions — race of victim, vulnerable defendants, what side of the county line the crime occurred and when it was tried, and the lack of meaningful judicial process — are all illegitimate bases to administer the law. The Court said America wasn’t able to administer the death penalty fairly or reliably a half century ago. The data show we still can’t do it today.”
The database contains the name, race, and gender of each defendant sentenced to death; the state and county (or federal district or military branch) of prosecution; the year of sentencing; the outcome of the particular sentence; and the final outcome or current status of the case.
DPIC’s analysis of the newly released data finds that five of six death sentences have not resulted in an execution. The single most likely outcome of a capital case once a death sentence is imposed is that the conviction or death sentence will be overturned and the defendant will not be resentenced to death. A death sentence is 3 times more likely to be reversed as a result of a court decision than it is to result in an execution.
The data also reflect continuing racial bias in the administration of capital punishment across the United States. “When it comes to executions,” Dunham said, “the data show that white lives matter more than Black lives.” Executions carried out over the 50 years were six times more likely to involve a white victim than only to involve victims who were Black. Defendants of color were disproportionately likely to be wrongfully convicted of capital offenses, took longer to be exonerated, and comprised an overwhelming majority of the likely intellectually disabled people who continue to be executed in the U.S. despite the constitutional prohibition against that practice.
60% of Black defendants who have been executed were sentenced to death for killing white victims. Just 34.4% of executions of African Americans were for killing Black victims. By contrast, 94.4% of executions of white prisoners were in cases involving white victims. Just 2.4% of executions of white prisoners were for killing Black victims and 2.3% were for killing Latinx victims.
The findings of the census even more strongly illustrate the geographic arbitrariness of the death penalty, first described in DPIC’s 2013 report, The 2% Death Penalty. Since the time of that report, the death penalty has grown even more geographically concentrated, with 34 counties — 1.1% of all U.S. counties — accounting for more than half of everyone on death row. Just 75 counties (2.4%) account for half of all death sentences imposed in the last 50 years. Just five counties — Harris (Houston), Dallas, Tarrant (Fort Worth), and Bexar (San Antonio) counties in Texas and Oklahoma County (Oklahoma City) — account for more than 20% of all the executions in the U.S. in the past half-century.
The data also document that most U.S. counties don’t practice capital punishment. Nearly 60% of U.S. counties have never imposed a death sentence. 83% of U.S. counties did not have anyone on death row. 84% of counties have not had any executions since Furman.
The census is available in an interactive, searchable database on DPIC’s website, and can be downloaded as a CSV file. Data from the census has also been incorporated into visualizations throughout the DPIC website. DPIC is continuing to review the data and will be adding new webpages over the coming months analyzing U.S. death penalty practices and trends over the past fifty years.
Death Penalty Census, Death Penalty Information Center, released June 28, 2022; Asia Ashley, 50 years after SCOTUS ruled death penalty cruel and unusual, race factors heavily in executions, CNHI Newspapers, June 28, 2022; Marty Schladen, Fifty years in, death penalty still unworkable, group says, Ohio Capital Journal, June 29, 2022; Danielle Haynes, 50 years after Furman ruling, death penalty may come down to states, experts say, UPI, June 29, 2022.


