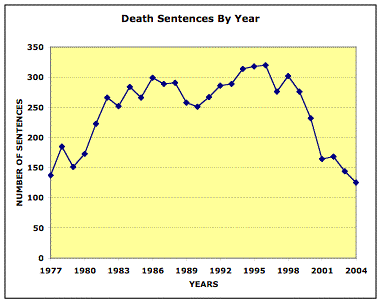
DEATH SENTENCES AT LOWEST LEVEL SINCE REINSTATEMENT OF DEATH PENALTY
Death Sentences by State:
| 2004 | 2003 | 1994 | |
| U.S. Total | 125 | 144 | 304 |
| Alabama | 8 | 6 | 24 |
| Arizona | 7 | 9 | 10 |
| Arkansas | 2 | 0 | 8 |
| California | 11 | 19 | 22 |
| Colorado | 0 | 1 | 0 |
| Connecticut | 1 | 0 | 0 |
| Delaware | 2 | 2 | 0 |
| Florida | 8 | 11 | 39 |
| Georgia | 4 | 1 | 6 |
| Idaho | 0 | 1 | 0 |
| Illinois | 3 | 2 | 11 |
| Indiana | 0 | 1 | 2 |
| Kansas | 1 | 1 | 0 |
| Kentucky | 1 | 0 | 4 |
| Louisiana | 7 | 1 | 6 |
| Maryland | 1 | 0 | 0 |
| Mississippi | 2 | 3 | 5 |
| Missouri | 3 | 3 | 9 |
| Montana | 0 | 0 | 0 |
| Nebraska | 1 | 0 | 1 |
| Nevada | 1 | 4 | 8 |
| N. Hampshire | 0 | 0 | 0 |
| New Jersey | 1 | 0 | 3 |
| New Mexico | 0 | 0 | 1 |
| New York | 0 | 1 | 0 |
| N. Carolina | 3 | 6 | 27 |
| Ohio | 5 | 7 | 13 |
| Oklahoma | 6 | 9 | 12 |
| Oregon | 2 | 2 | 6 |
| Pennsylvania | 4 | 6 | 21 |
| S. Carolina | 3 | 5 | 7 |
| S. Dakota | 0 | 0 | 0 |
| Tennessee | 5 | 6 | 4 |
| Texas | 23 | 29 | 43 |
| Utah | 0 | 0 | 0 |
| Virginia | 2 | 6 | 10 |
| Washington | 0 | 0 | 2 |
| Wyoming | 1 | 0 | 0 |
| Federal | 7 | 2 | 0 |
Sources: 2004 — NAACP Legal Defense Fund.
2003 – 1977 — Bureau of Justice Statistics (note: BJS revised the total for 1994 to 314 sentences).
See also DPIC’s Sentencing Page and DPIC’s Press Release on latest numbers.
Citation Guide
Sentencing Data
Mar 15, 2023

From The Marshall Project: “The Mercy Workers” —The Unique Role of Mitigation Specialists in Death Penalty Cases
Sentencing Data
Mar 01, 2023

RESEARCH: History of Lynchings Linked to Increased Death Sentencing for Black Defendants
Sentencing Data
Jul 01, 2022
